At a Glance
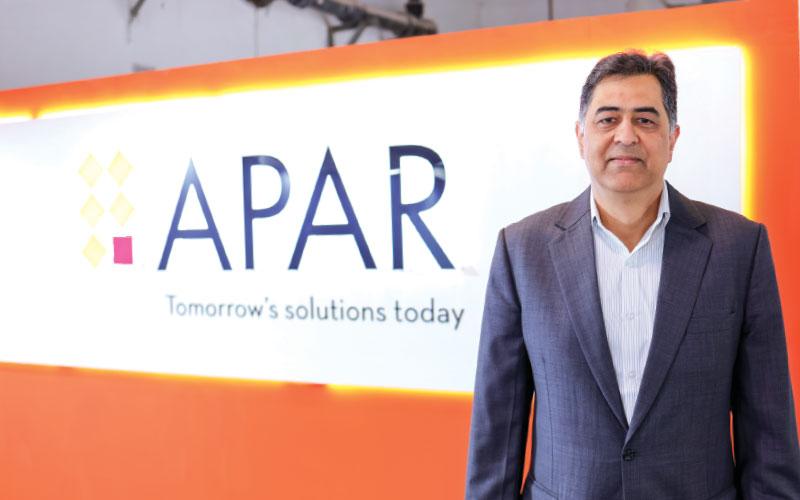
Apar Industries just electrified investors with a Q1 FY26 revenue of ₹5,104 crore (+27.3% YoY) and a PAT of ₹263 crore (+29.9% YoY). The stock, already trading at ₹9,801 (P/E 46), soared 13% today. With 32.7% ROCE, this cable-and-oil kingpin proves that voltage isn’t the only thing it amplifies – profits too!
Introduction
Founded in 1958, Apar isn’t some old-school wire maker. It’s the world’s largest conductor manufacturer and a major player in transformer oils and power/telecom cables. From lighting up remote villages to powering global grids, Apar has quietly become India’s electrification backbone. The recent numbers suggest it’s not slowing down – unless raw material costs short-circuit the party.
Business Model (WTF Do They Even Do?)
- Conductors (48% revenue): From aluminium to copper, Apar makes everything that carries electricity.
- Transformer & Specialty Oils (TSO): Oils that cool transformers and keep the power flowing.
- Power/Telecom Cables: High-voltage solutions and fiber support for the data-hungry world.
USP: Innovation-driven, exports to 140+ countries, and turnkey T&D solutions.
Financials Overview
Q1 FY26:
- Revenue: ₹5,104 Cr (+27%)
- EBITDA: ₹438 Cr (+23%)
- PAT: ₹263 Cr (+30%)
- Margins: OPM 9%, PAT margin 5.1%
Annual FY25:
- Revenue: ₹17,552 Cr
- EBITDA: ₹1,479 Cr
- PAT: ₹794 Cr
Growth is sizzling, margins healthy, and order flows robust.
Valuation
Quick math time:
- P/E: EPS ₹213 × 20 = ₹4,260
- EV/EBITDA: ₹1,559 Cr × 10 = ₹15,590 Cr EV → ₹3,800 per share
- DCF: Conservative 10% growth → ₹5,000
Fair Value Range: ₹4,000–₹5,000. Current ₹9,801 means the market is pricing it like Tesla – all future, little margin for error.
What’s Cooking – News, Triggers, Drama
- Demand Boom: Global conductor demand rising with renewable push.
- Capex: ₹600+ Cr investments planned to ramp capacity.
- US & Domestic Growth: Strong traction in export markets.
- Risks: Commodity price swings, high valuations, geopolitical trade barriers.
Balance Sheet
| Assets | ₹ Cr |
|---|---|
| Total Assets | 10,771 |
| Net Worth | 4,292 |
| Borrowings | 540 |
| Liabilities | 5,940 |
Comment: Low debt, high reserves – a healthy mix.
Cash Flow – Sab Number Game Hai
| Year | Ops | Investing | Financing |
|---|---|---|---|
| FY23 | ₹577 Cr | -₹251 Cr | -₹161 Cr |
| FY24 | -₹235 Cr | -₹263 Cr | ₹650 Cr |
| FY25 | ₹1,238 Cr | -₹699 Cr | -₹457 Cr |
Remark: Operating cash now positive and strong; FY24 was an anomaly.
Ratios – Sexy or Stressy?
| Ratio | Value |
|---|---|
| ROE | 19.9% |
| ROCE | 32.7% |
| P/E | 46 |
| PAT Margin | 4.6% |
| D/E | 0.1 |
Comment: ROCE is hot; D/E low. P/E, however, is screaming “premium”.
P&L Breakdown – Show Me the Money
| Year | Revenue | EBITDA | PAT |
|---|---|---|---|
| FY23 | ₹13,153 Cr | ₹1,183 Cr | ₹603 Cr |
| FY24 | ₹15,109 Cr | ₹1,519 Cr | ₹823 Cr |
| FY25 | ₹17,552 Cr | ₹1,479 Cr | ₹794 Cr |
Margins have stabilized around 8–9%.
Peer Comparison
| Company | Revenue (₹Cr) | PAT (₹Cr) | P/E |
|---|---|---|---|
| Waaree Energies | 15,461 | 2,221 | 41 |
| Premier Energies | 6,682 | 1,047 | 45 |
| Apar Industries | 18,687 | 856 | 46 |
Comment: Apar has size advantage, but profits lag behind solar peers.
Miscellaneous – Shareholding, Promoters
- Promoters: 57.8%
- FIIs: 9.06%
- DIIs: 21.8%
- Public: 11.4%
Promoter stake stable, institutional interest strong – investor confidence is buzzing.
EduInvesting Verdict™
Apar Industries is no longer just a cable company – it’s a growth monster riding electrification and renewable energy waves. With 30% profit growth and global leadership in conductors, it’s positioned to keep shocking the market.
SWOT
- Strengths: Global scale, high ROCE, diversified segments.
- Weaknesses: Thin PAT margins, high valuations.
- Opportunities: Renewable grid expansion, exports, specialty cables.
- Threats: Raw material volatility, global trade risks.
Final Word: Electrifying performance but priced at lightning levels. Invest only if you can handle high-voltage valuations.
Written by EduInvesting Team | 29 July 2025SEO Tags: Apar Industries, Q1 FY26 Results, Electrical Equipment Stocks, Power Transmission

