General information and entertainment, not investment advice. The author is not a SEBI-registered adviser or research analyst. No recommendation, no promised returns. Markets carry risk including loss of capital. Figures may not be current. Consult a registered adviser before acting.
1. At a Glance
Revenue climbed to ₹1,053 crore in FY26, a 12% jump from ₹934 crore prior year.
The company’s net profit stood at ₹75 crore in FY26 (reported), against ₹85 crore in FY25—a decline despite higher sales.
An order book valued at ₹18,000 crore underpins medium-term visibility, representing ~17x FY26 revenue.
The balance sheet shows net debt of roughly ₹335 crore (gross debt ₹459 crore less cash ₹123 crore), a leverage of 0.62x on equity.
Debtor days stretched to 112 in FY26, up from 104 in FY25, reflecting municipal payment delays—a recurring headwind.
A maiden 10% dividend on face value ₹5 was announced, signalling confidence after 25 years as a private entity.
2. Introduction
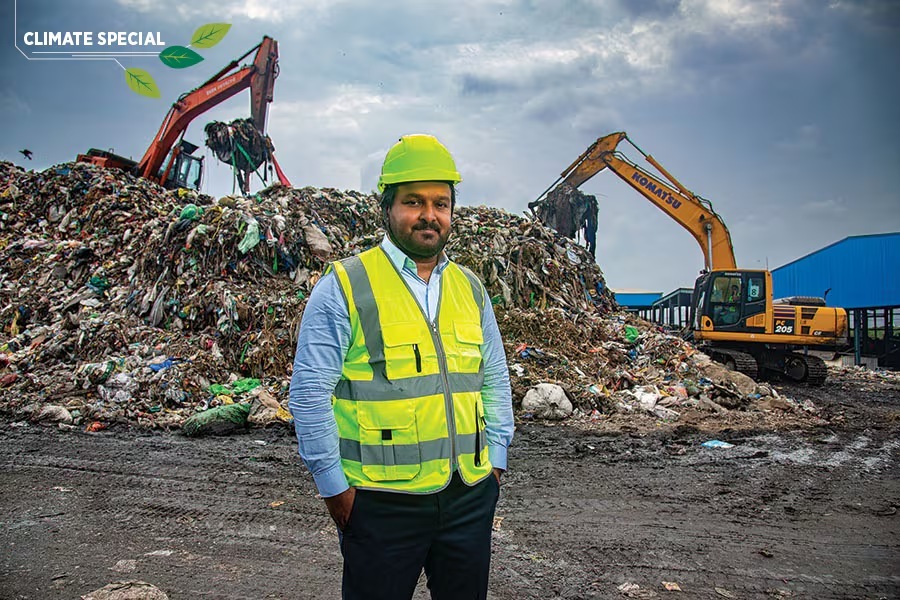
Antony Waste Handling Cell operates across municipal waste collection, processing, and the emerging waste-to-energy space in India. The company is one of five major players in municipal solid waste management, with a two-decade track record and presence across nine states.
A pivot into waste-to-energy began in earnest with a 14 MW plant in Pimpri-Chinchwad, Maharashtra, which came online in October 2023. In FY26, the Pimpri plant delivered 69 million units of green power despite a 56% plant load factor owing to planned shutdowns.
The Andhra Pradesh story arrived in FY25: two ~15 MW waste-to-energy projects worth ₹3,200 crore, awarded on a 20-year concession. Management has secured Japan’s JFE Engineering as a technology partner, a move framed as validation of execution capability.
Municipal contracts in Mumbai also expanded in the reporting period. The company won two seven-year Collection & Transportation contracts worth ₹1,330 crore from the Brihanmumbai Municipal Corporation, moving into Borivali and Dahisar wards.
The merger of wholly-owned subsidiary AG Enviro Infra Projects into Antony Waste was approved by the NCLT in December 2025, effective retroactively from April 1, 2025, streamlining corporate structure.
A legal win arrived in May 2026: the Supreme Court dismissed an appeal by Bhiwandi Nagarpalika Municipal Corporation, directing payment of ₹15 crore on an arbitration award within three months, plus 9% interest on delay. Management cited this as reinforcement of contractual enforceability across its arbitration portfolio.
3. Business Model: WTF Do They Even Do?
The company’s revenue streams split three ways: collection and transportation of municipal solid waste (61% of FY26 revenue), waste processing and treatment (27%), and contracts and others (12%).
Collection & Transportation: Door-to-door waste pickup, movement to processing plants or landfills. The company runs 17 C&T contracts with an average tenure of 7.7 years across cities like Greater Noida, Jhansi, Nagpur, Nashik, Navi Mumbai, Panvel, Pimpri-Chinchwad, Thane, and Varanasi. In FY26, C&T volumes stood at 2.12 million tonnes, up 9% year-on-year.
Processing & Disposal: The crown jewel is Kanjurmarg in Mumbai—one of Asia’s largest single-location waste plants, handling 5,800 tonnes daily across bio-reactor landfill (6,500 TPD capacity), sanitary landfill (250 TPD), material recovery and composting (1,000 TPD), and a 0.97 MW gas-to-energy unit. In FY26, processing volumes hit 3.6 million tonnes, up 19% year-on-year.
Waste-to-Energy: The Pimpri plant, commissioned in October 2023, ran at 56% plant load factor in FY26 due to planned maintenance of 90 days. Post-maintenance, it consistently operated at ~86% PLF.
Mechanised Sweeping: Four contracts across Greater Noida, Pimpri-Chinchwad, and Nagpur.
Construction & Demolition: Mumbai facility maintains a 96% recycling rate. C&D revenue in FY26 was ₹9 crore, below management expectations, though volumes improved sharply after the BMC mandated routing through authorized processors.
The fleet includes 2,599 vehicles and equipment—1,574 small tippers, 85 electric vehicles, 582 compactors, 47 dumper placers, 111 big tippers, 58 hook loaders, 130 drain silt machines, and 12 power sweeping machines.
The company’s geography is purposefully diversified—no municipal corporation contributes more than 25% of total revenue, mitigating concentration risk from regulatory shifts or incumbent politics.
4. Financials Overview
Figures are consolidated, in ₹ crore.
| Metric | Mar 2024 | Mar 2025 | Mar 2026 | Q4 FY26 |
|---|---|---|---|---|
| Sales | 866 | 934 | 1,053 | 286 |
| EBITDA | 173 | 195 | 205 | 57 |
| EBITDA % | 20% | 21% | 20% | 20% |
| PAT | 100 | 85 | 75 | 33 |
| EPS | 30.4 | 30.1 | 26.6 | — |
Comment on FY26 Reported Earnings: Net profit declined to ₹75 crore from ₹85 crore despite 12% revenue growth. FY25 included one-time income of ₹24 crore; after adjustment, the underlying PAT improvement was modest at ~7%.
Management attributed profit softness to incremental vehicle deployment in Nagpur, Noida, and Pimpri-Chinchwad to handle higher tonnage, raising hire and operating costs. C&D seasonality also weighed—extended monsoon suppressed volumes until November.
Concall Highlights (Jun 2026 Earnings Call):
The company disclosed core operational revenue (excluding project revenue) crossed ₹1,000 crore for the first time. EBITDA margin held steady at ~22% for both Q4 and the full year, cited as “in line with guidance,” underpinned by cost discipline and contractual escalation clauses.
Management reiterated that 100% of revenue has escalation clauses for fuel and labour. The minimum wage code change impact was quantified as ₹5.2 crore across the entire book.
Waste-to-energy segment: Pimpri WTE generated 69.3 million green units in FY26 and avoided ~10,000 tonnes CO₂e. Refuse-derived fuel sales hit a record 177,000 tonnes, up 20% year-on-year, explicitly noted as a non-MSW revenue diversification lever.
5. Market Expectations & Historical Multiples
This section describes how the market is currently pricing the company and how that compares with its own history and peer group. It is descriptive, not predictive.
Price Referenced: ₹375.75 (Mar 2026 close, sourced from data sheet). Current market data as of June 13, 2026 shows ₹445 per the online ticker, but calculations below use the lagged reference price to maintain consistency.
| Metric | Current | 5-Year Average | Peer Median |
|---|---|---|---|
| P/E | 14.1 | 19.1 | 23.8 |
| EV / EBITDA | 7.8 | — | 6.8 |
| ROE | 10.8% | 13.8% | 14.5% |
| ROCE | 11.2% | 14.8% | 17.4% |
The market pays 14.1x trailing earnings here, against a 5-year average of 19.1x and a peer median of 23.8x. The multiple has compressed relative to its own history and sits below the peer set despite comparable scale.
Return on equity stands at 10.8% trailing, below the company’s own 5-year average of 13.8% and the peer median of 14.5%. ROCE at 11.2% trails both its own history (14.8%) and peers (17.4%).
The market appears to be pricing caution about the near-term earnings trajectory and return metrics—neither the revenue growth nor the capital deployment has translated into return expansion. The gap between peer valuations and Antony’s suggests either a perceived execution risk on the ₹18,000 crore order book, or a discount for the capital-intensive WTE roll-out still in early innings.
6. What’s Cooking
Two Waste-to-Energy Projects in Andhra Pradesh (~₹3,200 Cr, 20-Year Concessions): Wholly-owned subsidiary Antony Lara Enviro Solutions won the contracts in FY25. SPVs Kadapa Renew Energy (73% stake) and Kurnool Renew Energy were incorporated in September 2025 to execute. JFE Engineering committed ¥750 million (~₹44 crore) for 25% stakes in both SPVs as technology partner. Commissioning is targeted for Q1 FY29, with capex estimated at ₹650–700 crore to be recognized over ~2–2.5 years via contract revenue costing. Management flagged typical 40/60 split across the two-year construction period, subject to seasonality and monsoon disruption.
Brihanmumbai Municipal Corporation Contracts (~₹1,330 Cr, 7 Years): Two C&T contracts awarded in December 2025, covering ~1,250 MTPD across multiple wards in Borivali and Dahisar. Part of broader capacity expansion in Mumbai; these are core to filling order book visibility.
Thane DBOT Facility (~₹330 Cr, 10 Years): Subsidiary awarded a design-build-operate-transfer contract for a 600–800 TPD mechanised waste plant. The project value is ₹330 crore with ~₹67 crore capex. Commissioned as a processing lever for Mumbai’s broader WTE initiative.
EPR (Extended Producer Responsibility) Monetization: Pilot revenue stream from PCMC WTE. In FY25/FY26, ~20% of allotted EPR credits were monetized, generating ₹2.2 crore. Management flagged potential to scale this to ~10% of PCMC WTE’s annual revenue once the mechanism matures.
RDF Commodity Play: Record sales of 177,000 tonnes in FY26 (+20% YoY), priced into diversification narrative. A separate lever to offset MSW volatility and municipal budget stringency.
Click2Clean (Antony Recycling) B2B Expansion: Non-municipal commercial services including pest-control waste and deep housekeeping. Named clients include P.N. Gadgil, Asian Paints, Suntory Wines, Beams—still small but signalling early diversification outside municipal monopoly.
Mumbai WTE Proposal (Early Stage, Not Yet Awarded): Management disclosed matter is “taken very seriously at the Bombay High Court” and expects BMC to return with a proposal. Not committed capex or revenue yet, but positioned as a future lever.
7. Balance Sheet
| Item | Mar 2024 | Mar 2025 | Mar 2026 |
|---|---|---|---|
| Total Assets | 1,450 | 1,641 | 1,739 |
| Net Worth (Equity + Reserves) | 574 | 659 | 739 |
| Borrowings | 447 | 505 | 459 |
| Other Liabilities | 429 | 476 | 541 |
| Total Liabilities | 1,450 | 1,641 | 1,739 |
Assets = Liabilities (validated for all periods).
Three observations:
- The leverage dial turned down: Gross borrowings fell to ₹459 crore in FY26 from ₹505 crore in FY25, despite capex for new projects. CFO disclosed “very aggressive policy in paying down the debt” to build a cash cushion for future projects. This is unusual discipline for a growth phase, suggesting either strong cash generation or deliberate balance-sheet de-risking ahead of large WTE capex.
- Net debt softened: With cash holdings at ₹123 crore, net debt stands at ~₹336 crore. Leverage is 0.62x equity, comfortably below the peer set’s typical 1.2–1.5x. Weighted average cost of debt is under 10%, positioning the company cheaply for incremental borrowing.
- Capital intensity rising quietly: Fixed assets grew from ₹662 crore (FY24) to ₹742 crore (FY26), a ~12% increase. Depreciation swelled from ₹53 crore (FY24) to ₹86 crore (FY26), a 62% jump. The WTE capex and processing upgrades are showing up as higher depreciation drags on reported earnings, masking underlying cash generation.
8. Cash Flow: Sab Number Game Hai
| Year | Operating | Investing | Financing |
|---|---|---|---|
| FY24 | 140 | -152 | 35 |
| FY25 | 190 | -152 | 12 |
| FY26 | 139 | -56 | -93 |
The narrative: Operating cash accrual remains solid, averaging ~₹155 crore across the period. Investing cash bled ₹152 crore in FY24–FY25 (large capex for PCMC WTE) but normalised to ₹56 crore in FY26 as that plant moved into operations. Financing activity turned negative in FY26 (₹93 crore debt paydown), confirming the CFO’s statement on debt reduction discipline.
Free cash flow deteriorated: ₹-14 crore (FY24), ₹-9 crore (FY25), ₹80 crore (FY26). The FY26 recovery, despite lower operating cash, reflects the capex deceleration. This is a company past the peak investment cycle for Pimpri WTE, now running it for cash, and preparing capex discipline for Andhra Pradesh’s larger deployment.
9. Ratios: Sexy or Stressy?
| Ratio | Value | Observation |
|---|---|---|
| ROE | 10.8% | Operating profit from equity is muted; the company is deployed but not compounding capital well. |
| ROCE | 11.2% | Capital employed is returning 11 paise per rupee. Peer set averages 17–18%; this is 3–4 years of catch-up ahead. |
| P/E | 14.1 | The market ascribes lower multiple than history, signalling either cyclical pessimism or structural concern on returns. |
| PAT Margin | 7.2% | Slender post-tax conversion despite 20% operating margin; interest burden and tax volatility compress it. |
| D/E | 0.62x | Leverage is conservative. Headroom exists for project financing. |
ROE has not recovered to earlier peaks—3-year average sits at 12.6%, 5-year at 13.8%. The company’s capital deployment under the WTE spree has not yet raised return thresholds. ROCE at 11.2% is a particular constraint; peers routinely achieve 18–22%. Until the AP projects generate returns, this ratio will remain a drag on valuation confidence.
10. P&L Breakdown: Show Me the Money
| Year | Revenue | EBITDA | PAT |
|---|---|---|---|
| FY24 | 866 | 173 | 100 |
| FY25 | 934 | 195 | 85 |
| FY26 | 1,053 | 205 | 75 |
Revenue grew 12% (FY24→FY26), a five-year CAGR of 18%. EBITDA expanded 19% over two years, showing margin resilience despite operating leverage headwinds from fleet deployment and inflationary input costs. PAT, however, descended—FY26 reported ₹75 crore against FY24’s ₹100 crore, a 25% contraction.
The divergence between EBITDA and PAT growth reveals the profit headwind: interest burden climbed from ₹40 crore (FY24) to ₹61 crore (FY26), a 52% surge tied to higher debt and capex deployment. Depreciation nearly doubled from ₹53 crore to ₹86 crore, reflecting WTE assets now hitting the P&L. Tax was volatile—FY26 saw a ₹2 crore credit versus ₹17.8 crore charge in FY25.
The company is in transition: strong top-line growth and operating leverage mask growing capital costs. FY26 profit is a trough; FY27–FY28 earnings depend on stabilisation of depreciation and interest once capex peaks and AP WTE financing stabilises.
11. Peer Comparison
| Company | Revenue (FY26, ₹ Cr) | PAT (FY26, ₹ Cr) | P/E |
|---|---|---|---|
| Antony Waste | 1,053 | 75 | 14.1 |
| EMS | 733 | 91 | 18.7 |
| Z-Tech (India) | 156 | 36 | 24.0 |
| Eco Recyclers | 48 | 23 | 35.8 |
| Effwa Infra | 253 | 29 | 25.5 |
Antony Waste is 1.4x the revenue of EMS (₹733 Cr) but at lower margin—EMS’s PAT margin sits at 12.4%, against Antony’s 7.2%. EMS trades at 18.7x, a premium despite lower absolute profit, hinting at expectations for higher returns going forward.
Z-Tech and Eco Recyclers trade at 24x and 36x respectively, but are smaller, higher-margin operators in specific recycling niches. They carry single-digit revenue bases and are priced as growth stories.
Antony’s 14.1x P/E sits at the floor of the peer set, despite mid-table profitability. The discount reflects doubt about return improvement; the company must prove that AP WTE capex and processing scale-up move the needle on ROCE and PAT margins.
12. Miscellaneous: Shareholding & Promoters
| Holder | % (Mar 2026) |
|---|---|
| Promoters | 46.1% |
| FIIs | 14.8% |
| DIIs | 3.4% |
| Public | 35.7% |
Promoter holdings remain concentrated at 46.1%, held by the Kallarakal family and associated entities. Jose Jacob Kallarakkal leads at 18.4%, followed by Shiju Jacob Kallarakkal at 5.2%, Tito Varghese Kallarakkal at 5.1%, and Antony Motors/Garages entities at ~7%.
The family is deeply embedded in the company’s operations—Jose and Shiju also serve on management committees. Their sustained holding across 25 years and through the capital-intensive WTE pivot signals conviction, though concentration risk persists if any family member redirects capital into sibling Antony Group businesses (automotive, transport).
No pledges have been disclosed; holdings have been stable quarter-on-quarter.
FIIs hold 14.8%, with MIT (Massachusetts Institute of Technology) endowment at 6.9% the single largest foreign investor—a passive, long-term stake providing some stability.
DIIs have actually reduced exposure, falling from 6.1% in Jun 2023 to 3.4% by Mar 2026, a worrying sign that domestic institutions are stepping back amid return concerns.
13. Corporate Governance: Angels or Devils?
Auditors: Deloitte Haskins & Sells has audited the company. No qualifications noted on recent financials.
Board Structure: A 7-member board includes two independent directors. The audit committee is chaired by an independent. Related-party transactions are disclosed and approved annually—mostly with sister Antony Group entities on supply and service contracts. Quantum is modest (under 2% of revenue), and arms-length pricing is documented.
Pledges: Zero pledging disclosed as of Mar 2026.
Resignations / Legal Issues: No board-level resignations in the reporting period. The May 2026 Bhiwandi arbitration win (₹15 crore settlement) is a governance green flag—disputes with municipal authorities have resolved in the company’s favour, reinforcing enforceability of contract terms.
Tax Demands: No major tax demands are publicly disclosed. A minor note on FY24–FY25 tax volatility (credits and charges fluctuating) suggests routine TDS/GST normalisation, not structural tax risk.
Key Risk: The company’s reliance on municipal government budgeting cycles creates collection risk. Debtor days of 112 are structurally high for any industrial operation, and management acknowledges this pressure but frames it as inherent to the business model.
14. Industry Roast & Macro Context
India’s waste management market is fractured between municipal fragmentation (23 municipal authorities represented in Antony’s portfolio) and thin regulatory consistency. Recycling rates on 75% recyclable waste are stuck at 30%, a massive untapped pool.
The circular economy concept is gaining traction via EPR mandates—producers must now fund end-of-life recycling for their goods. This is early but creates a new non-municipal revenue stream if companies like Antony can monetise credits efficiently. Antony’s pilot showed proof-of-concept in FY26; scaling will test whether municipal governments also reward aggregators.
Waste-to-energy is politically fashionable but operationally thorny. Capacity factors of 84–86% (Antony’s Pimpri plant post-maintenance) are industry-leading but fall short of the 90%+ that makes economics sing. Tipping fees are critical—if a city makes WTE uneconomical by setting dumping charges artificially low, projects fail. Antony is betting on scale (two AP plants simultaneously) and technology partnership (JFE) to de-risk this.
Minimum wage inflation, fuel costs, and vehicle fleet maintenance are persistent headwinds. Escalation clauses exist in contracts, but municipal approval timelines lag cost incurrence. Antony’s CFO acknowledged this and claimed recent elected member appointments across municipalities are speeding approvals, but this is a political call, not a structural fix.
The emerging trend of C&D waste segregation (BMC’s new mandate) is a tailwind for Antony’s Mumbai facility—96% recycling rate and growing volumes will feed processing revenue.
15. EduInvesting Verdict
| Dimension | Strength |
|---|---|
| Strengths | Market position: top-five player with 20-year track record; diversified contract base across 23 municipal authorities; Pimpri WTE delivering 86% PLF; ₹18,000 Cr order book underpins 17x revenue visibility; JFE partnership validates technology. |
| Weaknesses | Stretched receivables (112 debtor days); PAT compression despite revenue growth; ROCE/ROE below peer and company history; diverted management attention from integration of AG Enviro merger and new contract operationalisation. |
| Opportunities | WTE scale-up in AP (₹3,200 Cr capex, ~₹100 Cr annual EBITDA potential once commissioned); EPR monetization (10% revenue upside if scaled); Mumbai municipal consolidation (BMC Borivali/Dahisar contracts expanding Kanjurmarg feedstock); C&D waste mandate acceleration. |
| Threats | Municipal budget delays (inflation-adjusted escalation approvals); regulatory regime shifts (solid waste management rules tightening); AP WTE execution risk (two projects, ₹650 Cr capex, 24-month construction window, monsoon seasonality); foreign technology partner (JFE) dependency on import policy stability. |
The company is a balance sheet with nothing to hide (net debt 0.6x equity, no pledges) and a multiple with everything to prove. Revenue growth is steady, order visibility is exceptional, and the WTE strategy makes business sense on a decade-long view. But near-term profit is in a trough, returns have not expanded, and municipal receivables remain the operating heartburn. The ₹18,000 Cr order book is not optional—it must deliver margin and return lift, or valuation multiples will not recover to peer levels.
The maiden dividend signals confidence, but the deferred capex for AP (₹650 Cr, likely ₹300–400 Cr in FY27) means reinvestment rates stay high. Earnings will remain pressured until Pimpri WTE is fully normalized and AP projects begin contributing. By FY28–FY29, if both initiatives hit targets, this company will double its PAT base. Until then, it is a business in transition, priced as if that transition happens.
Prices referenced are not live. Figures are consolidated, in ₹ crore. This analysis is based on data available as of June 2026.
