Anmol India Ltd Mar 2026 : A Microcap Coal Trader Operating on a 1.35% Razor-Thin Margin
Section 1 — At a Glance
Anmol India Ltd presents a classic microcap paradox: a company pushing out a substantial ₹1,416.57 crore in annual revenue, yet valued at a market capitalization of just ₹64.21 crore. The market’s steep discount becomes clear when you look at the operating core: its operating profit margin sits at a razor-thin 1.35%. While top-line scale has historically expanded, net profitability remains deeply sensitive to global supply chains and international commodity price shifts.
Investor attention is currently torn between two opposing forces. On one hand, the company achieved a notable 62.4% recovery in net profit for FY26 to ₹11.30 crore, bouncing back from a severe industry-wide slump in FY25 where profits bottomed out at ₹6.99 crore. On the other hand, serious structural risks remain. Promoters have pledged 38.3% of their entire equity stake to secure banking arrangements. Furthermore, the company carries contingent liabilities of ₹222 crore and has historically skipped paying dividends despite remaining consistently profitable.
High volume combined with paper-thin margins leaves a business exposed to severe volatility; when operating cycles are tight, even minor global freight disruptions can quickly impact bottom-line profitability.
Let’s dive into the balance sheet and operational mechanics to see if this coal trader is currently uncovering value or simply skating on thin ice.
Section 2 — Introduction
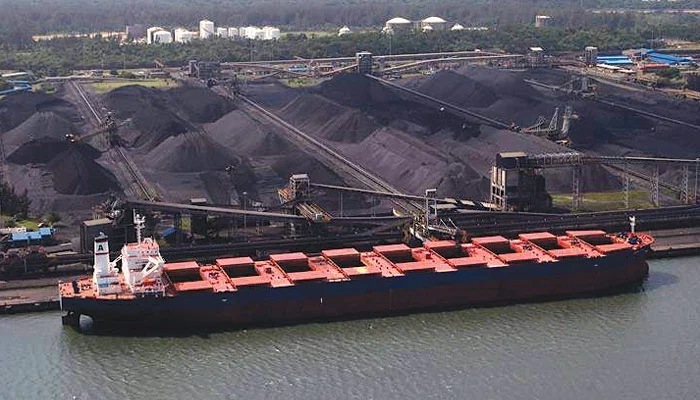
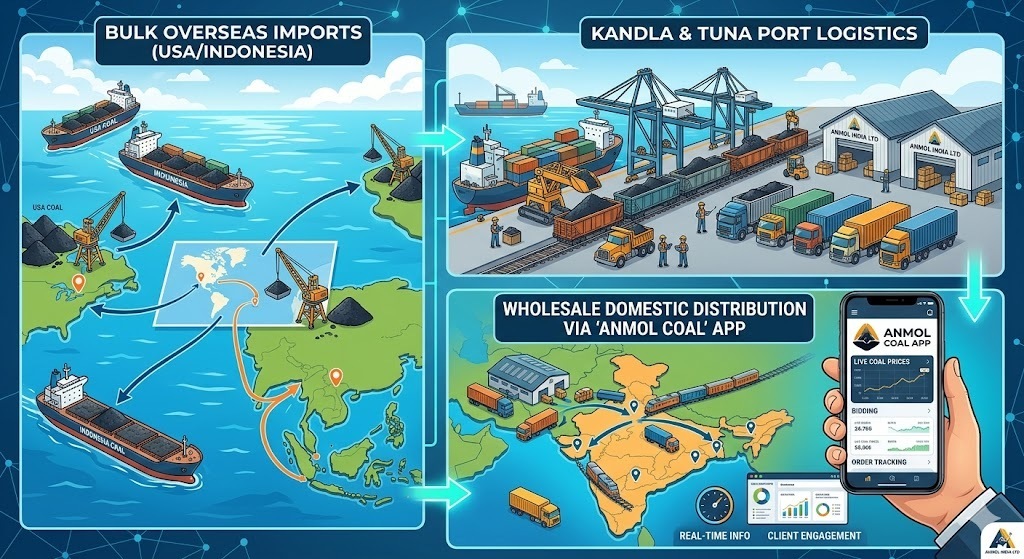
Anmol India Ltd has acted as an intermediary in the wholesale coal ecosystem for over two decades. It orchestrates bulk shipments, primarily coordinating the movement of high-calorific USA coal and Indonesian thermal coal through critical maritime trade hubs like the Kandla and Tuna ports in Gujarat.
The publication of its audited standalone FY26 results on May 16, 2026, makes a deep-dive analysis highly relevant. The stock has experienced a sharp 39.2% correction over the past year, drawing notice from the stock exchanges regarding its rapid price movements. With key structural changes unfolding—such as a strategic pivot into iron and steel trading and consecutive board room resignations of independent directors—investors need to look past the surface-level P/E ratio to evaluate the actual risk-reward dynamic.
Section 3 — Business Model: WTF Do They Even Do?
Anmol India does not mine a single lump of coal. Instead, it operates entirely as a high-volume trading and distribution entity. The business model revolves around purchasing imported steam coal, petroleum coke, and coking coal in bulk shipments, and subsequently breaking those cargoes down to sell on a truck-by-truck or wholesale basis to domestic industrial consumers across northern and western India.
To optimize its market position, management launched a dedicated mobile application, Anmol Coal, which functions as a digital portal for real-time price discovery, customer bidding, and client acquisition. While the company recently established an “Expansion and Growth Committee” to diversify into iron ore, chemical assets, and met coke, the business remains heavily tied to its core energy trading segments.
Section 4 — Financials Overview
Figures are consolidated, in ₹ crore.
Comparison Table
Metric
Latest Quarter (Mar 2026)
YoY (Mar 2025)
QoQ (Dec 2025)
Revenue
308.51
-1.82%
1.76%
EBITDA / Operating Profit
2.80
-37.08%
-45.53%
PAT
2.51
56.88%
-14.63%
EPS (₹)
0.44
57.14%
-15.38%
Note: Growth rates calculated directly from raw quarterly disclosures.
The quarterly performance highlights the inherent volatility of pure-play commodity trading. While quarterly PAT saw a