1. At a Glance
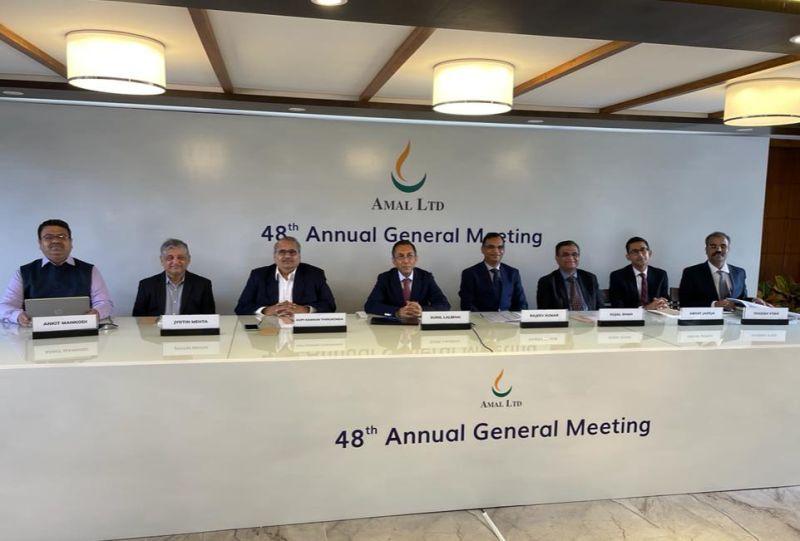
Amal Ltd is a microcap chemical company that went from bleeding sulphur (literally) to printing 36% ROCE. Its sales grew 4x in 5 years, PAT went from ₹1 Cr to ₹38 Cr, and debt? Gone. And yet — P/E is under 26, market cap under ₹1,000 Cr, and book value? Just ₹80.2. So, hidden gem or just sulphur-induced hallucination?
2. Introduction with Hook
What happens when a sleepy old Gujarat chemical plant wakes up, hires a solid team, repurposes its tanks, and starts minting margins like a tech startup?
- Sales: ₹33 Cr (FY20) → ₹162 Cr (TTM) = 5x
- Net Profit: ₹1 Cr → ₹38 Cr = 38x
- ROCE: 36%, OPM: 32%, and zero debt.
This is not Deepak Nitrite. This is Amal Ltd, the forgotten cousin in the Atul Ltd family, quietly cooking chemicals — and compounding wealth like an overenthusiastic lab intern.
3. Business Model (WTF Do They Even Do?)
Amal Ltd makes chemicals. Boring ones. But high-margin boring ones.
- Core Products: Sulphuric Acid, Oleum, Sulphur Dioxide, Sulphur Trioxide
- Industries Served: Dyes, fertilizers, detergents, agrochem, pharma
- Key Moat: Cost-efficiency + location advantage (Ankleshwar Industrial Cluster)
- Ownership: Part of Atul Ltd Group — big brother with credibility
It’s a raw material supplier that sells to the people who sell to you.
4. Financials Overview
| FY | Sales (Cr) | EBITDA (Cr) | OPM % | PAT (Cr) | EPS | ROCE % | ROE % |
|---|---|---|---|---|---|---|---|
| 2020 | ₹33 | ₹14 | 43% | ₹9 | ₹7.4 | — | — |
| 2022 | ₹43 | ₹4 | 9% | ₹1 | ₹0.9 | 4% | 1% |
| 2023 | ₹61 | ₹-6 | -9% | ₹-16 | ₹-13 | -12% | — |
| 2024 | ₹86 | ₹15 | 18% | ₹2 | ₹1.4 | 7% | 2% |
| 2025 | ₹135 | ₹43 | 32% | ₹29 | ₹23.7 | 36% | 34% |
| TTM | ₹162 | ₹52 | 32% | ₹38 | ₹30.9 | 36% | 34% |
Mic Drop Moment: From negative PAT to ₹38 Cr in 2 years. That’s not a turnaround. That’s a chemical revolution.
5. Valuation
- P/E: 25.9
- P/B: 9.98 (yikes)
- EV/EBITDA: ~19x
- Dividend Yield: 0.12%
Fair Value Range:
- Bear Case: EPS ₹30 × PE 15 = ₹450
- Base Case: EPS ₹30 × PE 25 = ₹750
- Bull Case: EPS ₹35 × PE 30 = ₹1,050
Fair Value Range: ₹450 – ₹1,050
Current Price = ₹800
So technically… it’s already near the top-end of fundamentals, unless growth continues this strong.
6. What’s Cooking – News, Triggers, Drama
- July 2025 Q1 Profit: ₹9.4 Cr — double of Q4 FY25
- ROCE at 36%: Most listed companies would sell kidneys for that
- Zero Debt Now: Deleveraging done.
- New Independent Director Appointed (Aug 2025): Sign of corporate clean-up?
- Sales grew 81% YoY (TTM) — not normal for sulphur guys
- Capex in past 2 years → finally delivering results
- Margins expanded like a soufflé in a pressure cooker
7. Balance Sheet
| Year | Equity Cap | Reserves | Borrowings | Total Liabilities | Total Assets |
|---|---|---|---|---|---|
| 2020 | ₹9 Cr | ₹16 Cr | ₹4 Cr | ₹34 Cr | ₹34 Cr |
| 2022 | ₹9 Cr | ₹26 Cr | ₹51 Cr | ₹100 Cr | ₹100 Cr |
| 2025 | ₹12 Cr | ₹87 Cr | ₹0 Cr | ₹122 Cr | ₹122 Cr |
Takeaways:
- Debt wiped clean
- Reserves 5x in 5 years
- Fixed Assets up from ₹10 Cr to ₹80 Cr (thanks to Capex cycle)
- Company now operating with real scale
8. Cash Flow – Sab Number Game Hai
| Year | Operating CF | Investing CF | Financing CF | Net CF |
|---|---|---|---|---|
| FY22 | ₹-1 Cr | ₹-43 Cr | ₹44 Cr | ₹0 Cr |
| FY23 | ₹-10 Cr | ₹-16 Cr | ₹29 Cr | ₹3 Cr |
| FY25 | ₹50 Cr | ₹-22 Cr | ₹-25 Cr | ₹3 Cr |
Conclusion:
They used to spend heavily on Capex + finance it with equity + loans. Now, they’re generating cash like pros. FY25 was first real year of free cash flow happiness.
9. Ratios – Sexy or Stressy?
| Metric | FY23 | FY24 | FY25 |
|---|---|---|---|
| ROE | – | 2% | 34% |
| ROCE | -12% | 7% | 36% |
| OPM | -9% | 18% | 32% |
| Debtor Days | 25 | 23 | 27 |
| Inventory Days | 26 | 28 | 33 |
| CCC | 21 | 15 | -9 |
Judgment: Sexy as hell. Zero working capital stress. CCC negative. This is acid-powered cash conversion.
10. P&L Breakdown – Show Me the Money
| FY | Sales | EBITDA | PAT | EPS | Div Payout |
|---|---|---|---|---|---|
| 2022 | ₹43 Cr | ₹4 Cr | ₹1 Cr | ₹0.9 | 0% |
| 2023 | ₹61 Cr | ₹-6 Cr | ₹-16 Cr | ₹-13 | 0% |
| 2025 | ₹135 Cr | ₹43 Cr | ₹29 Cr | ₹23.7 | 4% |
Comment: This is the “Deepak Nitrite” phase… early cycle, mega OPM, and barely any dividend. Investors clearly asked the company to reinvest, not reward.
11. Peer Comparison
| Company | CMP | P/E | ROE | ROCE | OPM | Sales (Cr) | PAT (Cr) | Mcap (Cr) |
|---|---|---|---|---|---|---|---|---|
| Deepak Nitrite | ₹1988 | 39 | 13.7% | 16.6% | 13.2% | ₹8282 | ₹697 | ₹27,116 Cr |
| Atul Ltd | ₹7385 | 44.6 | 9.1% | 12.8% | 16.4% | ₹5583 | ₹487 | ₹21,742 Cr |
| Navin Fluoro | ₹5073 | 87.2 | 11.5% | 11.7% | 22.7% | ₹2349 | ₹289 | ₹25,161 Cr |
| Amal Ltd | ₹800 | 25.9 | 34.6% | 36.0% | 32% | ₹162 | ₹38 | ₹990 Cr |
Verdict: Return ratios better than everyone in the list. Problem? Tiny base. But if growth sustains — this goes from “who’s this?” to “oh wow!”
12. Miscellaneous – Shareholding, Promoters
- Promoter Holding: 71.34%
- Public: 28.64%
- FII/DII: Virtually none — undiscovered territory
- Shareholders Count: ~14.5K
- No pledges, no drama, no corporate controversies
- Linked to Atul Ltd: Strategic asset with upstream integration
13. EduInvesting Verdict™
Amal Ltd is the Gujarat sulphur story you never paid attention to. From acid loss to acid boss, the turnaround is textbook — high OPM, zero debt, explosive profit growth, and return ratios that could embarrass a unicorn startup.
But… don’t get carried away. This is still a microcap with 1–2 product lines, cyclical exposure, and low liquidity. If you’re in, you’re betting not just on sulphur — you’re betting on continued industrial demand, disciplined Capex, and no freak chemical explosions (financial or otherwise).
Metadata
– Written by EduInvesting Research | 12 July 2025
– Tags: Amal Ltd, Sulphuric Acid, Ankleshwar Chemicals, Turnaround Stocks, High ROCE, Smallcap Chemical, Edu Style, 13 Point Article

