General information and entertainment, not investment advice. The author is not a SEBI-registered adviser or research analyst. No recommendation, no promised returns. Markets carry risk including loss of capital. Figures may not be current. Consult a registered adviser before acting.
1. At a Glance
Akanksha Power and Infrastructure closed FY26 with revenue of ₹91.62 crore, up from ₹78.74 crore — a 16.36% climb that management attributes to steady order execution. Net profit reached ₹5.83 crore. Operating profit did the heavier lifting, rising to ₹11.39 crore from ₹8.23 crore, pushing operating margin from 10.45% to 12.43%.
Then there’s the balance-sheet line that dwarfs everything else. Fixed assets jumped from ₹15.54 crore to ₹45.60 crore — the presentation flags a 153.94% increase, driven by the acquisition and commissioning of a Medium Voltage capacitor line and technology from TDK, live from 11 February 2026. A plant that expensive, commissioned six weeks before year-end, contributed little to FY26 sales by management’s own account.
So the company spent big on capacity that hasn’t earned yet, while borrowings climbed from ₹26.76 crore to ₹43.08 crore. The market pays roughly 28.5x earnings for the result.
A capacitor maker in Nashik that suddenly weighs like a much larger business — the question is whether the machines start paying rent. Read on.
2. Introduction
Founded in July 2008 by Bipin B. Dasmohapatra, Akanksha Power makes electrical equipment — capacitors, transformers, vacuum contactors, and power-quality panels — for industries and utilities. It listed on the NSE SME Emerge platform in January 2024, raising ₹27.49 crore for capex and working capital, per the Crisil rationale.
FY26 was, in the company’s telling, a year of rewiring. The headline move was the TDK capacitor facility, relocated, commissioned, and commercialized during the year. Around it sat a cluster of announcements: a brand-label agreement with Schneider Electric India for LV-APP capacitors (₹15–20 Cr per year, deliveries from March 2026), a ₹21.59 crore purchase order under Maharashtra’s RDSS programme in April 2025, and the earlier acquisition of a majority stake in Famous Power Limited, a solar subsidiary that holds a letter of award from the Government of Odisha.
Two structural things also happened. CFO Chaitali Dasmohapatra resigned on 23 January 2026, with Sandeep Kedar appointed from 5 February 2026. And a former subsidiary, Akanksha Hanbit Smart Technologies, saw the company’s stake fall from 55% to 23%, ceasing to be a subsidiary as of March 2026 — which management notes makes prior-year figures not strictly comparable.
3. Business Model: WTF Do They Even Do?
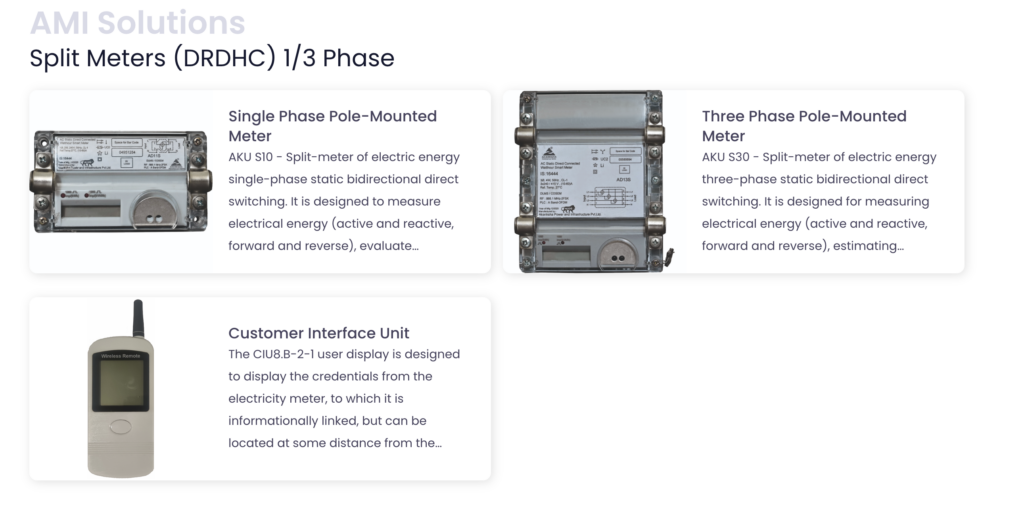
Akanksha sells the unglamorous plumbing of electricity. When a factory’s power factor sags and its motors draw sloppy, inefficient current, someone has to install the boxes that fix it. Akanksha makes those boxes: shunt, surge and pulse capacitors rated up to 40 kV, series reactors, vacuum contactors, current and voltage transformers, residual voltage transformers, and smart meters.

The pitch is a framework the company brands DNA — Diagnose, Navigate, Action — which is a tidy way of saying they measure your power-quality problem, plan a fix, and sell you the hardware to implement it. On top of the metal sits software: a billing-and-analytics platform for utilities that turns meter data into invoices.
By the FY23 disclosures, roughly 54% of revenue came from product and 46% from services and turnkey projects, and the client list reads seriously — Military Engineer Services, HAL, Coal India, Hindalco, IOCL, L&T. The presentation adds newer names it says it won within a short window of the TDK line going live: GE Vernova, NEI, and EPKOM.
The pulse-capacitor brochure lists applications including radar, pulsed lasers, and MRI machines — which is a wide spread for a company doing ₹91 crore of revenue. The product range is broad; the scale underneath it is not. That tension runs through the whole entry.
4. Financials Overview
Figures are consolidated, in ₹ crore. The result type here is half-yearly; the latest reported half is the six months to September 2025.
| Metric (₹ cr) | Latest Half (Sep 2025) | YoY (vs Sep 2024) | Prev Half (Mar 2025) |
|---|---|---|---|
| Revenue | 43.80 | +66.9% | 52.50 |
| Operating Profit | 4.97 | +80.1% | 5.46 |
| Net Profit | 2.41 | +55.5% | 2.83 |
| EPS (₹) | 1.23 | +50.0% | 1.45 |
The year-on-year jump is real; the half-on-half dip reflects that the March half is seasonally the larger one. Half-yearly EPS is not annualised.
From the presentation: management framed FY26 as “transformational,” citing operating profit growth of 38.40% outpacing revenue growth of 16.36%, and attributed the margin expansion to improved operating efficiency. It also flagged that the TDK line commenced operations near year-end, so its revenue contribution during FY26 was limited.
5. Market Expectations & Historical Multiples
This section describes how the market is currently pricing the company and how that compares with its own history and peer group. It is descriptive, not predictive.
| Metric | Current | Historical Average | Peer Median |
|---|---|---|---|
| P/E | ~28.5x | — | 30.07x |
| P/B | 2.32x | — | — |
| EV/EBITDA | 16.2x | — | — |
| ROE | 8.41% | 8.34% (3-yr) | — |
| ROCE | 11.0% | 13.13% (FY24) | 21.05% |
The market currently pays about 28.5x earnings here, a shade under the peer median of roughly 30x and the industry P/E of 30.8. ROCE of 11.0% sits below both its own FY24 level of 13.13% and the peer median of 21.05%.
What the market appears to be pricing in is the second act, not the first: a nearly tripled fixed-asset base from the TDK line, a Schneider Electric branding agreement, and an order book Crisil pegged at ₹83 crore against FY25 revenue of ₹78.74 crore — capacity and backlog that, per management, largely haven’t shown up in earnings yet. The current multiple rests on machines running near-empty at the time of reporting rather than on demonstrated throughput.
One factual observation: the earnings supporting today’s multiple were produced before the year’s largest asset started contributing.
6. What’s Cooking
Four things sit on the record, and only four.
The TDK Medium Voltage capacitor line was acquired, commissioned, and commercialized on 11 February 2026 — the single largest event of the year, and the reason fixed assets ballooned. The Schneider Electric brand-label deal (marketed as “Lauritz Knudsen”) is sized at ₹15–20 crore per year with deliveries from March 2026. On governance, the CFO changed hands mid-year. And a ₹21.59 crore RDSS purchase order landed in April 2025.
Does an ₹83 crore order book and a world-class new line justify a near-market multiple, or is it a bet that the machines fill up on schedule?
7. Balance Sheet
| Item (₹ cr) | FY24 | FY25 | FY26 |
|---|---|---|---|
| Total Assets | 77.62 | 116.23 | 141.26 |
| Net Worth | 45.24 | 66.23 | 71.69 |
| Borrowings | 14.47 | 26.76 | 43.08 |
| Other Liabilities | 17.91 | 23.24 | 26.49 |
| Total Liabilities | 77.62 | 116.23 | 141.26 |
Assets equal liabilities in every column.
- Borrowings tripled across two years — ₹14.47 crore to ₹43.08 crore — while the fixed-asset base did most of its growing in the final year.
- Net worth rose to ₹71.69 crore, helped by retained earnings and an earlier equity infusion; the Crisil rationale notes a ₹27.49 crore IPO and warrant money received.
- Cash and bank stood at ₹1.84 crore against ₹43.08 crore of borrowings — this is a net-debt balance sheet, not a net-cash one.
A company that borrows to build capacity is placing a wager on demand it has already booked. The order book is the collateral; execution is the interest payment.
8. Cash Flow: Sab Number Game Hai
| Year | Operating | Investing | Financing |
|---|---|---|---|
| FY24 | -22.93 | -6.60 | 26.25 |
| FY25 | -0.11 | -14.44 | 22.48 |
| FY26 | 10.18 | -29.72 | 12.55 |
Operating cash flow finally turned positive in FY26 at ₹10.18 crore, after two years underwater. Investing outflow hit ₹29.72 crore — the TDK spend showing up in cash terms. Financing brought in ₹12.55 crore to help fund it. For three straight years, the money going into assets and out of borrowings has exceeded what operations generated. FY26 is the first year operations pulled their weight; the capex bill still outran them.
9. Ratios: Sexy or Stressy?
| Ratio | Value |
|---|---|
| ROE | 8.41% |
| ROCE | 11.0% |
| P/E | ~28.5x |
| PAT Margin | 6.4% |
| D/E | 0.60 |
ROE of 8.41% means the equity is clocking in part-time. ROCE at 11.0% has drifted down from 13.13% in FY24 — management attributes the dip to the capex whose benefits haven’t yet reached earnings. PAT margin of 6.4% is thin, the signature of a company that assembles and installs rather than owns pricing power. Debt-to-equity of 0.60 is moderate, though it has risen with the borrowing.
10. P&L Breakdown: Show Me the Money
| Year | Revenue | Operating Profit | Other Income | PAT | EPS (₹) |
|---|---|---|---|---|---|
| FY24 | 56.53 | 5.63 | 0.93 | 2.78 | 1.50 |
| FY25 | 78.74 | 8.23 | 1.58 | 4.34 | 2.22 |
| FY26 | 91.62 | 11.39 | 1.45 | 5.83 | 2.98 |
Other income of ₹1.45 crore against operating profit of ₹11.39 crore is small enough that the profit is mostly the real business — a healthier picture than many small caps, where non-operating gains prop up the headline. Operating profit and PAT both rose faster than revenue across the three years.
EPS guard: one earlier oddity is worth naming. FY23 EPS was reported at ₹15.65 on net profit of ₹2.84 crore; FY24 EPS then read ₹1.50 on essentially flat profit of ₹2.78 crore. That collapse is not a profit decline — the share count expanded massively (a bonus issue of 10,890,000 shares plus the IPO), so per-share figures reset onto a far larger base. The business didn’t shrink; the denominator grew.
11. Peer Comparison
| Company | Revenue Qtr (₹ cr) | PAT Qtr (₹ cr) | P/E |
|---|---|---|---|
| Waaree Energies | 8,480 | 1,126 | 20.8 |
| Apar Inds. | 6,603 | 253 | 56.8 |
| Premier Energies | 2,230 | 457 | 30.8 |
| MTAR Technologies | 306 | 44 | 219.9 |
| Diamond Power | 715 | 57 | 80.5 |
| Akanksha Power | 43.80 | 2.41 | ~28.5 |
Akanksha is the smallest name in its comparison set by an order of magnitude, carrying a multiple close to the peer median of 30x on a fraction of the quarterly profit. The peer group’s ROCE median of 21.05% is roughly double Akanksha’s 11.0%. It sits in the room priced like the neighbours while operating at a different weight class.
12. Miscellaneous: Shareholding & Promoters
| Holder | % (Mar 2026) |
|---|---|
| Promoters | 57.51 |
| Institutions | 0.00 |
| Public | 42.49 |
Promoter holding eased from 60.81% to 57.51% over the year. Institutional holding — FIIs and DIIs — has drained to zero; both had small positions in early 2024 that are now gone. The promoter group is a family affair: Bipin Dasmohapatra (Managing Director, 31.64%), Chaitali Dasmohapatra (Director, 21.81%), with two more family members holding smaller slices. Of the promoter stake, the data sheet flags 13.3% as pledged — a detail worth carrying forward to governance.
13. Corporate Governance: Angels or Devils?
The audit came clean: Kayde & Associates issued an unmodified opinion on both standalone and consolidated FY26 results, approved by the board on 10 June 2026. The single event with a governance dimension is the CFO transition — Chaitali Dasmohapatra out on 23 January 2026, Sandeep Kedar in from 5 February 2026.
Three facts sit on the ledger without embellishment. The board and promoter group are the same family. The promoter pledge stands at 13.3%. And the profit-and-loss statement carries a related-party marker, while a former subsidiary was deconsolidated during the year as the stake fell from 55% to 23%. Each is disclosed; each is the kind of line a reader tracks over time.
14. Industry Roast & Macro Context
Power-quality equipment is a business of standards and patience. You sell capacitors and transformers into DISCOMs and industrial buyers who tender slowly, pay slower, and hold retention money like a security deposit they never intend to fully return. That’s the sector’s tax on everyone in it — Crisil noted debtors here ranging 130 to 200 days over three years, including retention money and receivables from group companies.
Government schemes like RDSS keep the order pipeline flowing, which is the upside of selling to the grid, and the tender cycle is the downside. It’s a sector where scale is the only real moat: the big names in the peer table earn 20–45% ROCE partly because volume spreads fixed costs thin. Below a certain size, the economies of scale simply aren’t there yet — a dynamic that describes exactly where this company sits.
15. EduInvesting Verdict
| Strengths | Weaknesses |
|---|---|
| Operating margin expanded to 12.43%; OP grew 38.4% | ROCE fell to 11.0%, below peer median of 21% |
| Operating cash flow turned positive at ₹10.18 cr | Borrowings tripled to ₹43.08 cr; net-debt balance sheet |
| Debtor days improved sharply to 97.25 | Institutional holding drained to zero; 13.3% promoter pledge |
| Opportunities | Threats |
|---|---|
| TDK line + Schneider deal + ₹83 cr order book | Family-run board, related-party marker, subsidiary deconsolidated |
| Capacity for growth beyond current ₹91.62 cr revenue | Thin 6.4% PAT margin in a scale-driven sector |
FY26 is the year Akanksha built the factory. Whether it was worth building is a question the income statement hasn’t answered yet, because the machines arrived in February and the year ended in March. A balance sheet that grew 154% in fixed assets, a multiple priced near its larger peers, and an order book that has to convert into the earnings everyone is already paying for — the capacity is installed, and the proof is pending.