1. At a Glance
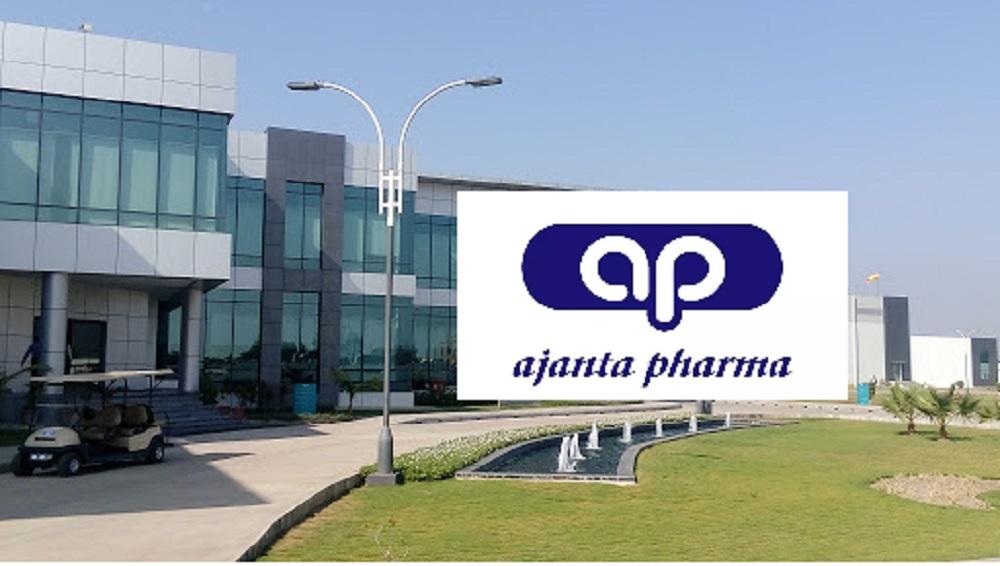
Ajanta Pharma pulled off a decent Q1 FY26 with Revenue ₹1,303 Cr (+13.8% YoY) and Net Profit ₹255 Cr (+3.9% YoY). Margins stayed strong at 27% OPM, proving it’s still a beast in niche generics despite pricing pressure.
2. Introduction
Imagine a pharma player that doesn’t chase blockbuster drugs but still keeps minting money. That’s Ajanta. With 24.9% ROE and zero debt drama, it’s the quiet overachiever of the pharma pack.
3. Business Model – WTF Do They Even Do?
- India (31% Rev): Branded generics in cardiology, ophthalmology, dermatology, pain management.
- Rest of the World: Africa branded generics, US generics, Asia formulations.
- Moat: First-to-market strategy (50% products 1st to market), 2800+ MRs, and consistent pipeline launches.
4. Financials Overview
- Q1 FY26 Revenue: ₹1,303 Cr
- Net Profit: ₹255 Cr
- FY25 PAT: ₹930 Cr
Verdict: Steady growth, strong cash generation, no fireworks but no flames either.
5. Valuation – What’s This Stock Worth?
- P/E: 37x
- Book Value: ₹303 (P/BV 9.1x)
- Fair Value Range: ₹2,400 – ₹3,100
Punchline: At 37x, it’s priced like a premium pharma story – because it is one.
6. What-If Scenarios
- Bull Case: US pipeline surprises, India launches click → ₹3,200.
- Bear Case: Generic price wars → ₹2,400.
- Base Case: ₹2,800 – ₹3,000, cruising with stable earnings.
7. What’s Cooking (SWOT)
Strengths: Debt-free, strong branded generics, high ROCE.
Weakness: Slower profit growth vs peers, promoter stake down 4%.
Opportunities: New launches in regulated markets.
Threats: USFDA shocks, currency volatility.
8. Balance Sheet 💰
| Particulars (Mar’25) | Amount (₹ Cr) |
|---|---|
| Equity Capital | 25 |
| Reserves | 3,765 |
| Borrowings | 47 |
| Total Liabilities | 4,904 |
| Comment: Solid balance sheet, almost debt-free, cash-rich. |
9. Cash Flow (FY23–FY25)
| Year | CFO (₹ Cr) | CFI (₹ Cr) | CFF (₹ Cr) |
|---|---|---|---|
| FY23 | 792 | -560 | -108 |
| FY24 | 785 | 65 | -1,051 |
| FY25 | 1,157 | -377 | -733 |
| Snark: CFO consistently strong – Ajanta prints cash like a pharma ATM. |
10. Ratios – Sexy or Stressy?
| Metric | Value |
|---|---|
| ROE | 25% |
| ROCE | 32% |
| D/E | 0.0x |
| OPM | 27% |
| P/E | 37x |
| Punchline: Ratios scream “premium”, not “panic”. |
11. P&L Breakdown – Show Me the Money
| Year | Revenue (₹ Cr) | EBITDA (₹ Cr) | PAT (₹ Cr) |
|---|---|---|---|
| FY23 | 3,743 | 808 | 588 |
| FY24 | 4,209 | 1,172 | 816 |
| FY25 | 4,648 | 1,269 | 920 |
| TTM | 4,806 | 1,280 | 930 |
| Comment: Topline stable, margins fat, profits healthy – pharma dream run. |
12. Peer Comparison
| Company | Rev (₹ Cr) | PAT (₹ Cr) | P/E |
|---|---|---|---|
| Sun Pharma | 52,578 | 11,454 | 36 |
| Cipla | 27,811 | 5,379 | 24 |
| Torrent P. | 11,516 | 1,916 | 64 |
| Ajanta P. | 4,806 | 930 | 37 |
| Peer verdict: Ajanta is small but punches above its weight in profitability. |
13. EduInvesting Verdict™
Ajanta Pharma is the disciplined student in the pharma class – no scandals, no heavy debt, just consistent A+ grades. For investors, it’s a steady compounder, not a moonshot.
Written by EduInvesting Team | 28 July 2025
Tags: Ajanta Pharma, Branded Generics, Pharma Analysis, EduInvesting Premium

