1. At a Glance
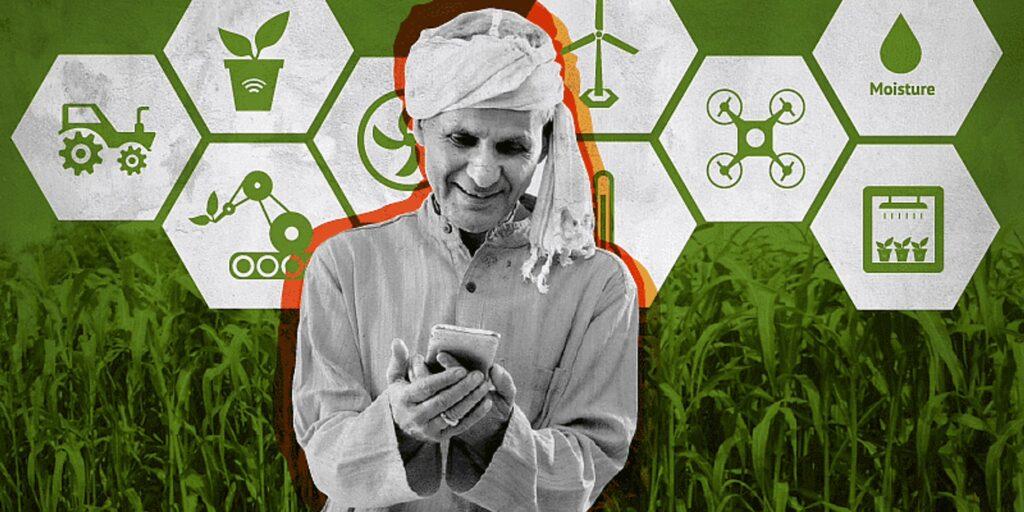
Agri-Tech India, the so-called corporate farmer, just harvested another Q1 loss of ₹0.1 Cr on peanuts for revenue (₹0.12 Cr). With promoters holding barely 30.9%, the stock trades below book value (0.87x), but that’s because investors see it as a museum of losses rather than a farm.
2. Introduction
Imagine running farms in Maharashtra and still losing money – Agri-Tech India proves agriculture isn’t always green. The company, despite being debt-free, keeps bleeding cash like a leaky irrigation pipe.
3. Business Model – WTF Do They Even Do?
- Core: Corporate farming of horticulture crops (fruits, plantations).
- Operations: Paithan, Maharashtra.
- Problem: Low scale, inconsistent yields, and losses make this “corporate farming” look like a hobby.
4. Financials Overview
- Q1 FY26 Revenue: ₹0.12 Cr
- Net Loss: ₹0.10 Cr
- ROE: -1.1%
Verdict: With revenue lower than a roadside mango seller, losses continue to rot.
5. Valuation – What’s This Stock Worth?
- P/E: NA (loss-making)
- Book Value: ₹169
- Fair Value Range: ₹100–₹140
Punchline: Trading at a discount to BV, but the business is also discounted by reality.
6. What-If Scenarios
- Bull: Diversification into high-value crops + land sale → ₹180
- Bear: Continued micro-revenue → ₹100
- Base: ₹120–₹140, unless a miracle monsoon arrives.
7. What’s Cooking (SWOT)
Strengths: Debt-free, large land bank potential.
Weakness: Chronic losses, contingent liabilities ₹43.6 Cr.
Opportunities: Land monetization, JV with agritech players.
Threats: Low promoter stake, negative ROE, operational inefficiency.
8. Balance Sheet 💰
| Particulars (Mar’25) | ₹ Cr |
|---|---|
| Equity Capital | 5.94 |
| Reserves | 94.2 |
| Borrowings | 0.0 |
| Total Liabilities | 101.9 |
| Comment: Clean balance sheet but zero earning power. |
9. Cash Flow (FY23–FY25)
| Year | CFO | CFI | CFF |
|---|---|---|---|
| FY23 | -₹1.55 Cr | -₹3.06 Cr | ₹4.93 Cr |
| FY24 | -₹10.66 Cr | ₹19.44 Cr | -₹8.47 Cr |
| FY25 | -₹0.64 Cr | ₹0.23 Cr | ₹0.0 Cr |
| Snark: CFO negative for years – the cash pipeline is clogged. |
10. Ratios – Sexy or Stressy?
| Metric | Value |
|---|---|
| ROE | -1.1% |
| ROCE | -1.1% |
| OPM | Negative |
| D/E | 0.0 |
| Punchline: Debt-free but also profit-free. |
11. P&L Breakdown – Show Me the Money
| Year | Revenue | EBITDA | PAT |
|---|---|---|---|
| FY23 | ₹0.23 Cr | -₹0.7 Cr | -₹0.39 Cr |
| FY24 | ₹0.18 Cr | -₹1.05 Cr | -₹1.11 Cr |
| FY25 | ₹0.22 Cr | -₹0.49 Cr | -₹0.56 Cr |
| Comment: Three years of red ink on green fields. |
12. Peer Comparison
| Company | Rev (₹ Cr) | PAT (₹ Cr) | P/E |
|---|---|---|---|
| LT Foods | 9,075 | 621 | 27 |
| KRBL | 5,594 | 476 | 19 |
| Agri-Tech | 0.22 | -0.56 | NA |
| Peer verdict: It’s like comparing a sapling to a forest. |
13. EduInvesting Verdict™
Agri-Tech India is basically land wrapped in a listed entity, bleeding operationally. Unless they sell land, find a JV, or pivot into something scalable, it remains a value trap disguised as a farm.
Written by EduInvesting Team | 28 July 2025
Tags: Agri-Tech India, Corporate Farming, Q1 FY26 Results, EduInvesting Premium

