Search for Stocks /

Agarwal Toughened Glass FY26: Revenue Nearly Doubles to ₹95 Cr, While Operating Cash Flow Turns Negative ₹8.5 Cr

Spotted a factual error — a wrong number, date, or fact? Tell us and we will check the source.

General information and entertainment, not investment advice. The author is not a SEBI-registered adviser or research analyst. No recommendation, no promised returns. Markets carry risk including loss of capital. Figures may not be current. Consult a registered adviser before acting.

1 — At a Glance

Agarwal Toughened Glass India closed FY26 with sales of ₹94.92 crore, up from ₹55.31 crore a year earlier — a 72% jump. Profit after tax reached ₹21.6 crore against ₹15.17 crore, and reported EPS came in at ₹12.22. Operating margin held near 30%. On the top line and bottom line, this was the loudest year in the company’s listed life.

Then the cash flow statement clears its throat. Cash from operating activities for FY26 was negative ₹8.5 crore, against a positive ₹14.7 crore the year before. Receivables climbed from ₹18.23 crore to ₹34.54 crore and inventory from ₹16.98 crore to ₹29.41 crore over the same twelve months — the arithmetic sits on the balance sheet. Profit that grows while operating cash leaves the building is the kind of tension this record exists to note.

A ₹236 crore company, promoter-held at 64.16%, that in April saw its credit rating revised down a notch and marked “issuer not cooperating.” A reader question to hold through what follows: does a doubling top line settle anything when the cash it generates went the other way?

2 — Introduction

Incorporated in October 2009 and operating out of Jaipur, Rajasthan, Agarwal Toughened Glass processes float glass into toughened, laminated, insulated and specialty glass. Commercial operations began in May 2016; the equity shares listed on the NSE Emerge SME platform on 5 December 2024, after an IPO that raised ₹62.64 crore.

The listed chapter has been eventful. In January 2026 the company signed a two-year trademark licence and technical partnership with Saint-Gobain, effective through December 2027. In September 2025 it flagged installed machinery adding roughly 5 lakh square metres a year of jumbo glass capacity. And on 3 July 2026 the board allotted 16.51 lakh equity shares and 45.90 lakh warrants on a preferential basis at ₹109, a raise of up to ₹68.04 crore.

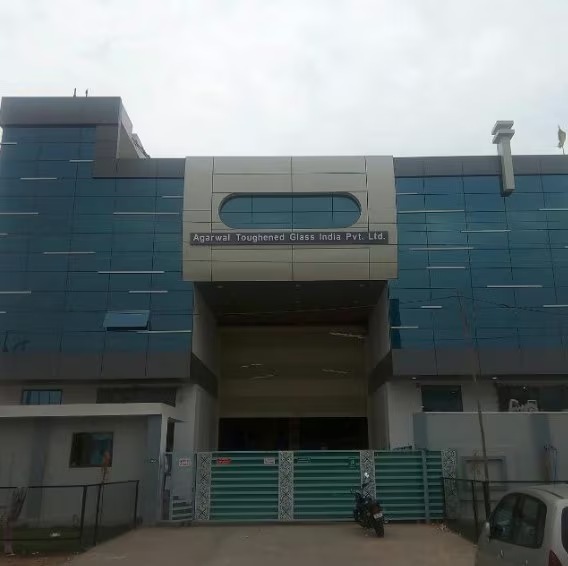
Photos from Agarwal Toughened Glass India Private Limited, Jaipur - Manufacturer of Toughened Glass

The IPO utilisation certificate shows most fresh-issue objects funded by March 2026, with ₹3.98 crore of the machinery allocation still unspent. The company reports standalone financials only, audited by Jethani & Associates, who issued an unmodified opinion on the FY26 numbers.

3 — Business Model: WTF Do They Even Do?

They take flat glass and make it harder to break — and then charge more for the versions that do interesting things. The FY25 revenue mix runs toughened glass 44%, DGU/insulated units 34%, laminated 22%. Toughened glass is also the input into the laminated and DGU products, so the company is partly its own supplier.

The end markets are wherever glass has to survive being looked at or leaned on: facades, windows, shower doors, hospital partitions, automotive safety glass. The client list names Yamaha, Saint-Gobain, Renault, Power Grid Corporation and Hyatt Regency, across 4,000-plus executed projects.

Three Jaipur facilities do the work. Unit 1 runs 612,000 sq. m of toughened capacity; Unit 2 adds 1,080,000 sq. m. Utilisation, per the company’s own disclosure, sits around 57% on Unit 1 toughened, 47% on IGU, and 47% on Unit 2 — which means the plants are already built to make roughly twice what they currently make. The pitch, then, is less “build more” and more “sell into what’s standing.” A glass processor whose main constraint isn’t the furnace but the order book is an honest kind of business to be in.

4 — Financials Overview

Figures are standalone, in ₹ crore.

The reporting is half-yearly. The latest half is the six months to March 2026 (H2 FY26).

MetricLatest Half (H2 FY26)YoY (vs H2 FY25)Prev Half (H1 FY26)
Revenue49+48% (from 33)46
Operating Profit14+8% (from 13)14
PAT9−18% (from 11)12
EPS (₹)5.28−12% (from 6.01)6.94

Revenue in the half rose sharply, operating profit barely moved, and PAT fell. The tax line explains part of the gap: the effective tax rate on the March 2026 half was 35%, against 14% in the March 2025 half — the percentages are on the data sheet. Higher sales, flat operating profit, a heavier tax bite: three facts stacked, no story added.

The June 2025 concall carried management’s own framing. On margins, the promoter said current levels would be “sustained… and increased,” attributing that to larger projects, upfront-payment supplier discounts, and a richer value-added mix. Management also guided to a 30–35% EBITDA margin range and said benefits would show in reported numbers over 8–12 months. That is management’s forecast, quoted as theirs.

5 — Market Expectations & Historical Multiples

This section describes how the market is currently pricing the company and how that compares with its own history and peer group. It is descriptive, not predictive.

MetricCurrentHistorical AveragePeer Median
P/E10.927.6
P/B2.04
ROE20.6%25.2% (5-yr)
ROCE23.0%20.8%

The market currently pays about 11x earnings here, against a peer median near 28x and an industry P/E of 27.6. On return on capital, the company sits above the peer median at 23%. On return on equity, the current 20.6% runs below its own five-year average of 25.2% — the equity base expanded sharply after the IPO, which mechanically dilutes the ratio.

What the market appears to be pricing at this multiple, using facts already in this record: a company growing revenue fast but generating negative operating cash flow in FY26, carrying a downgraded “issuer not cooperating” credit rating, and having just diluted further through a July preferential raise. The single factual observation to end on: the market pays roughly a third of the peer multiple here.

6 — What’s Cooking

The 3 July 2026 preferential allotment is the headline: 16.51 lakh equity shares and 45.90 lakh warrants at ₹109, taking paid-up capital to 1,93,26,466 shares from 1,76,74,600. The raise is up to ₹68.04 crore, with warrants convertible on or before January 2028.

The Saint-Gobain trademark-and-technical partnership, signed January 2026, runs two years. A ₹5 crore DGU order for 17,000 sq. m arrived from Ramacivil India in July 2025, slated for December 2025 completion. And the September 2025 jumbo-glass capacity addition of roughly 5 lakh sq. m a year rounds out the operational news. Four real events, reported at their stated sizes.

7 — Balance Sheet

ItemMar 2024Mar 2025Mar 2026
Total Assets51.66132.38148.45
Net Worth16.4394.22115.82
Borrowings29.2433.6824.68
Other Liabilities5.994.487.95
Total Liabilities51.66132.38148.45

Assets equal liabilities in every column. Three observations aimed at the numbers:

  • Net worth quintupled between FY24 and FY25, from ₹16.43 crore to ₹94.22 crore — the ₹62.64 crore IPO doing the heavy lifting, not retained earnings.
  • Borrowings actually fell in FY26, from ₹33.68 crore to ₹24.68 crore, a ₹9 crore reduction that quietly undercuts any picture of a company drowning in debt.
  • Cash and bank fell from ₹33.87 crore to ₹10.65 crore over FY26, so against ₹24.68 crore of borrowings this is a net-debt balance sheet, not net cash.

A company can raise ₹63 crore and still find, two years later, that most of it has flowed into receivables and inventory rather than the bank. The balance sheet is where growth’s bill comes due.

8 — Cash Flow: Sab Number Game Hai

YearOperatingInvestingFinancing
FY2411.3−5.13−2.04
FY2514.7−13.6167.06
FY26−8.5−4.56−10.16

FY25’s ₹67 crore financing inflow is the IPO. FY26 tells the harder story: operating activity turned negative ₹8.5 crore even as PAT hit ₹21.6 crore. The money went into working capital — receivables up ₹16 crore, inventory up ₹12 crore across the year, per the balance sheet. Profit is an opinion until the cash confirms it; in FY26 the cash abstained.

9 — Ratios: Sexy or Stressy?

RatioValue
ROE20.6%
ROCE23.0%
P/E10.9
PAT Margin22.8%
D/E0.21

ROCE at 23% shows the capital employed is earning its keep. ROE at 20.6% describes equity that works hard but less hard than before dilution enlarged the base. The 22.8% PAT margin is unusually fat for a glass processor, and it leans partly on ₹5.14 crore of other income sitting inside a ₹21.6 crore profit. D/E of 0.21 marks a lightly geared company — the borrowings shrank while the equity swelled.

10 — P&L Breakdown: Show Me the Money

YearRevenueOperating ProfitOther IncomePATEPS (₹)
FY2438.33142.178.597.23
FY2555.31203.0015.178.58
FY2694.92285.1421.6012.22

The trajectory is genuinely steep: revenue up 148% across two years, operating profit doubling. The Other Income column is the one to watch — ₹5.14 crore in FY26, or nearly a quarter of PAT, from sources outside the core glass business. Anchor on operating profit (₹28 crore) and PAT (₹21.6 crore) together, and the operating engine is still doing most of the pulling — but the non-operating contribution has grown every year in absolute terms. EPS moved in line with PAT here, so no share-count distortion clouds the FY26 figure.

11 — Peer Comparison

CompanyRevenue (Qtr)PAT (Qtr)P/E
Borosil Renewables439.92169.1226.64
Borosil Scientific143.1727.2536.76
Sejal Glass114.5511.4228.50
Agarwal Toughened49.049.3410.94
Agarwal Float26.850.0220.20
Agarwal Fortune0.420.01108.83

Agarwal Toughened carries the lowest multiple in the set at roughly 11x, against a peer median near 28x — a company priced at well under half the group multiple while posting a healthier quarterly PAT than three of its five peers. The two same-family names, Agarwal Float and Agarwal Fortune, sit at near-zero quarterly profit and multiples that range from 20x to an eye-watering 109x on almost no earnings.

12 — Miscellaneous: Shareholding & Promoters

Holder% (Mar 2026)
Promoters64.16
Institutions (FII + DII)6.90
Public28.94

The promoter Agarwal family holds the controlling block, with Sharda Agarwal (24.89%) and Mahesh Kumar Agarwal (19.14%) the largest individual holders. The company is chaired by Anita Agarwal as Chairman and Managing Director. Promoters participated in the July preferential raise, subscribing shares and warrants alongside identified non-promoter allottees — control being reinforced rather than diluted through that route.

13 — Corporate Governance: Angels or Devils?

The record here carries several flat facts worth laying in order. In April 2026, Crisil revised the rating on the company’s ₹8.7 crore bank facilities to ‘B/Stable’ from ‘B+/Stable’, both carrying the “issuer not cooperating” suffix — the agency stated it had followed up repeatedly without receiving the requested information. In June 2026, NSE sought clarification under Regulation 33 regarding the March 2026 quarter results, and the company submitted delayed SDD compliance certificates after non-compliance notices. The Company Secretary, Tanvi Maru, resigned in December 2025, with Varsha Sethi appointed the same day.

On the other side: the statutory auditors issued an unmodified opinion, the promoter pledge is nil, and despite six straight years of the machine-generated cons flagging it, the company pays no dividend while reporting profits. A clean audit opinion and a non-cooperating credit file, filed in the same year, is a combination the reader gets to weigh.

14 — Industry Roast & Macro Context

Processed architectural glass is a business where the supplier holds the whip. Management noted float-glass suppliers are few enough to demand 100% advance payment and grant no credit — so the entire industry’s working capital is structurally front-loaded, and growth means financing inventory before you’ve been paid. That’s the sector’s original sin: every large project you win is a loan you extend to yourself.

Demand-side, the pitch rests on construction, real estate and a slow shift toward premium value-added glass — laminated, DGU, jumbo formats that fewer processors can make. It’s a real moat where it exists and a commodity grind where it doesn’t. The glass industry rewards those who can wait to get paid; the balance sheet decides who can afford to.

15 — EduInvesting Verdict

StrengthsWeaknesses
Revenue up 72% in FY26; ROCE 23%FY26 operating cash flow negative ₹8.5 Cr
Borrowings cut ₹9 Cr; D/E 0.21Working capital days rose to 293
OpportunitiesThreats
~50% plant utilisation leaves room to scaleCredit rating cut to B, “issuer not cooperating”
Saint-Gobain tie-up; jumbo capacity liveNSE Reg 33 clarification; no-dividend record

Two years of doubling revenue sit on top of a year where the cash walked out the door and the rating agency stopped getting its calls returned. The multiple is a third of the peer group’s, and the reasons for that discount are printed plainly in the cash flow statement and the credit file.

A profit-and-loss account sprinting ahead of a cash flow statement that refused to follow — and a growth story the credit agency couldn’t get anyone to narrate.

Leave a Reply