Aaron Industries Ltd March 2026: The ₹55 Crore Asset Pivot and the 40% Tax Trap
Section 1 — At a Glance
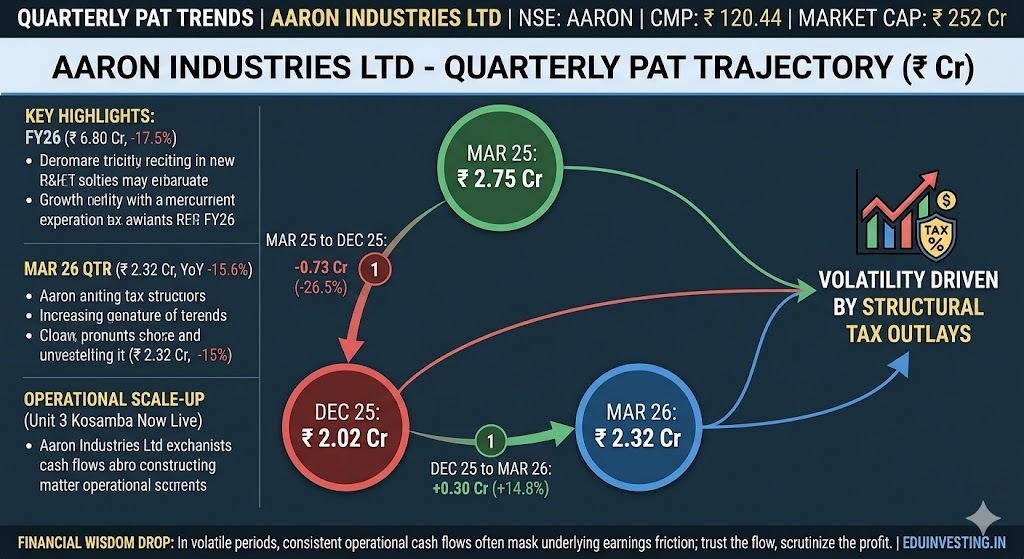
Aaron Industries Ltd has wrapped up March 2026 by delivering a steady top-line execution alongside a structural compression in its bottom-line earnings quality. Total revenue from operations for the full fiscal year grew 18.06% to ₹92.00 crore, up from ₹77.93 crore in the previous year. Operating profit before interest, depreciation, and tax (EBITDA) rose 19.01% to ₹17.89 crore. However, the company’s net profit after tax (PAT) contracted by 17.54% to ₹6.80 crore, dragging down reported earnings per share (EPS) to ₹3.27.
The divergence between top-line expansion and bottom-line pain has generated sharp polarization among market observers. On one hand, long-term capital allocators are zeroing in on the successful commissioning of the massive Unit 3 manufacturing facility in Kosamba, Surat. This structural expansion pushed the net block of fixed assets up from ₹24.88 crore to ₹55.33 crore. This massive layout triples component capacity and unlocks highly automated production systems. On the flip side, cautious observers are signaling immediate stress lines. The capital deployment has triggered a near-doubling of depreciation to ₹3.88 crore and a 90% spike in interest obligations to ₹2.59 crore. Concurrently, an uncharacteristically high annual effective tax rate of 40.54% has swallowed a substantial portion of operating cash flows. Earnings acceleration cannot occur until structural operating leverage overrides these immediate fixed overheads.
Valuation multiples reflect future execution, but actual wealth creation is strictly governed by the immediate friction of capital costs and tax outlays.
Section 2 — Introduction
Aaron Industries Ltd occupies a niche corner within the domestic capital goods sector, serving as an engineering supplier to the vertical mobility industry. Moving from an SME platform to the mainboard in late 2020 marked its structural shift, but the real operational transition is occurring right now. The company is currently executing a migration of its primary manufacturing base from its legacy footprint to an integrated production hub.
This deep-dive analysis arrives at a critical juncture. The fiscal year ending March 2026 represents the initial phase where the financial statements must absorb the complete impact of this capital layout. With a newly established capacity base now live, the narrative shifts entirely away from engineering construction and settles squarely on volume distribution and market penetration. This report strips away management optimism to audit whether the balance sheet’s new productive capacity is built to deliver economic returns or chronic margin friction.
Section 3 — Business Model: WTF Do They Even Do?
Aaron Industries operates a vertically integrated production model divided across two main divisions: the Elevator Division and the Steel Polishing Division. The company operates as an Original Equipment Manufacturer (OEM) that handles fabrication for 40% to 50% of core elevator components in-house, focusing on automatic door systems, passenger lift cabins, and specialized safety frames.
The operational core of the company is its integration model. The Steel Polishing Division processes raw stainless-steel coils into mirror-polished, embossed, and decorative sheets. The Elevator Division consumes the majority of this output to build premium cabins, while the remainder is sold externally to other elevator fabricators and architectural designers.
The company avoids the execution risks of final on-site installation. Instead, it sells its components to licensed B2B installers, traders, and national OEMs, leaving the real estate field coordination to third-party intermediaries.
Section 4 — Financials Overview
Figures are consolidated, in ₹ crore.
Comparison Table
Metric
Latest Quarter (Mar 2026)
YoY (Mar 2025)
QoQ (Dec 2025)
Revenue
27.33
24.11
23.20
EBITDA / Operating Profit
5.08
5.04
4.84
PAT
2.32
2.75
2.02
EPS (₹)
1.11
1.32
0.96
The quarterly numbers highlight a sequential recovery in business volume, with revenue expanding 17.81% sequentially to ₹27.33 crore. This top-line progression reflects the structural back-ended seasonality typical of the capital goods sector, where shipments accelerate rapidly into the close of the fiscal year. However, operating efficiency showed minor compression, as quarterly EBITDA margins slipped from 20.90% in March 2025 to 18.59% in the latest quarter. The ultimate damage was sustained at the net level, where a 35.73% tax layout left PAT at ₹2.32 crore, lower than the ₹2.75 crore recorded in the corresponding quarter of the previous year.
Did Management Walk the Talk?
Reviewing management’s performance over the past two quarters reveals a mix of structural execution and volume slippage. During late 2025, management explicitly blamed early and prolonged monsoons for stalling site project deliveries and causing an execution backlog. They maintained their stance that all delayed volumes would move into the second half of the year. The surge in March 2026 revenues to ₹27.33 crore confirms that shipments did pick up.
However, management previously expressed confidence in maintaining stable employee costs and driving margin expansions through automation. The financial statements tell a different story. Annual employee costs rose from ₹6.47 crore to ₹8.24 crore. This increase was caused by