1. At a Glance
Stainless steel tubes so shiny they reflect your regrets, Suraj Ltd is in the business of niche but necessary metal plumbing for the industrial elite. But with working capital days ballooning and debtor days doing the worm, this isn’t your average “smallcap rocket” — it’s a boutique chaos engine with 65x P/E. Buckle in.
2. Introduction with Hook
If investing in Suraj Ltd were a party, it would be the quiet guest with a metal briefcase and a weird backstory.
On one hand, it makes stainless steel tubes up to 30 meters long. On the other, it posted a -7.17% OPM in Mar’25 and 274L profit in Q1 FY26 that somehow includes Rs. 2.57 Cr in “other income.” In short: the real product might just be creative accounting.
3. Business Model (WTF Do They Even Do?)
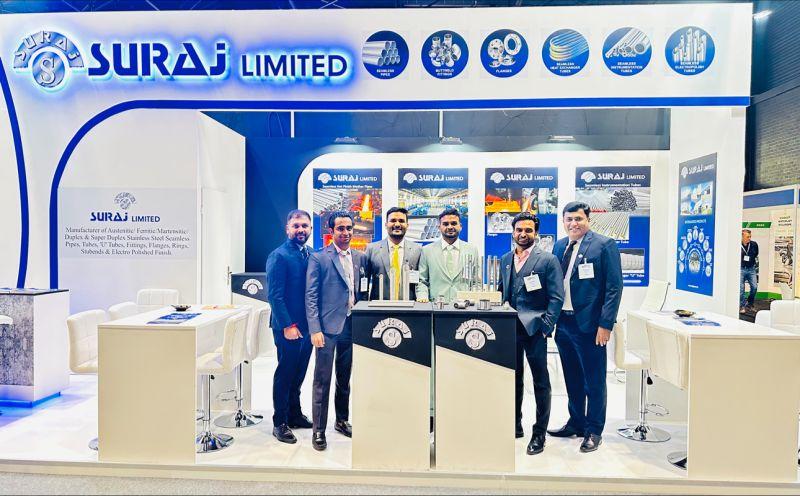
Suraj Ltd makes stainless steel seamless pipes, ‘U’ tubes (because straight lines are boring), and other custom tubing that go into heat exchangers, condensers, and power plant components. Think industrial arteries — and they want you to believe it’s open-heart surgery.
Translation: they bend metal tubes, polish them till they sparkle, and invoice you like it’s aerospace engineering.
Their specialty? Tubes so long (30m) they could stretch across your broken dreams — or your last startup pitch deck.
4. Financials Overview
Let’s hit you with the numbers, iron pipe style:
| Metric | FY25 (Cr) | Q1 FY26 (Cr) |
|---|---|---|
| Revenue | 234 | 50.34 |
| Operating Profit | 28 | 4.84 |
| Net Profit | 13 | 2.74 |
| OPM % | 12% | 9.6% |
| ROCE | 12.7% | – |
| ROE | 10% | – |
Highlights? That 274L PAT in Q1 includes 2.57 Cr in other income. Remove that and this quarter looks like a Netflix horror short.
Margins? Tighter than Mumbai parking spots. And with working capital days zooming to 131, this is officially a slow-motion billing opera.
5. Valuation
a) P/E Method
- TTM EPS = ₹5.63
- CMP = ₹369
- P/E = 65.5x
- Fair Value Range (assuming 25–35x normalized P/E) = ₹140–₹197
b) EV/EBITDA
- FY25 EBITDA = ₹28 Cr
- Approx. EV = ₹682 Cr (Market Cap) + ₹64 Cr (Debt) – ~₹10 Cr (Cash) = ₹736 Cr
- EV/EBITDA = 26.2x
- Fair Value (at 12–16x EV/EBITDA) = ₹130–₹185
Conclusion? If you think 65x earnings for a metal tube company is rational, you probably also think airport tea is reasonably priced.
6. What’s Cooking – News, Triggers, Drama
- Q1 FY26 Earnings: Rs. 274L PAT (Rs. 154L standalone). But “Other Income” did the heavy lifting.
- SEBI Non-Compliance: Company paid fines recently — because filing on time is overrated.
- Debtor Days: From 40 to 51. That’s 11 extra days of chasing clients and emailing “gentle reminders.”
This story has more plot twists than a daily soap — but less glamour and more tubes.
7. Balance Sheet
| Particulars (₹ Cr) | FY24 | FY25 |
|---|---|---|
| Equity Capital | 18 | 18 |
| Reserves | 104 | 115 |
| Borrowings | 34 | 64 |
| Other Liabilities | 29 | 25 |
| Total Liabilities | 186 | 222 |
| Fixed Assets | 85 | 89 |
| Investments | 14 | 15 |
| Other Assets | 87 | 118 |
Key Points:
- Debt almost doubled YoY
- Asset-light? Not really
- Investments exist, but nobody knows what they are
8. Cash Flow – Sab Number Game Hai
| Year | CFO | CFI | CFF | Net CF |
|---|---|---|---|---|
| FY23 | 45 Cr | -19 Cr | -26 Cr | 0 Cr |
| FY24 | 41 Cr | -47 Cr | +6 Cr | 0 Cr |
| FY25 | -9 Cr | -14 Cr | +23 Cr | 0 Cr |
Commentary:
Operating cash flow in FY25 turned negative. The company’s cash position looks like your freelancer friend — always working, never paid.
9. Ratios – Sexy or Stressy?
| Metric | FY25 |
|---|---|
| ROE | 10% |
| ROCE | 12.7% |
| D/E Ratio | 0.56 |
| PAT Margin | 5.5% |
| P/E Ratio | 65.9x |
Verdict:
ROCE is meh. ROE is okayish. P/E is comedy. This stock’s valuation is hotter than a dosa tawa at midnight, but the fundamentals are lukewarm at best.
10. P&L Breakdown – Show Me the Money
| Year | Revenue | EBITDA | PAT |
|---|---|---|---|
| FY23 | 367 Cr | 35 Cr | 20 Cr |
| FY24 | 331 Cr | 39 Cr | 22 Cr |
| FY25 | 234 Cr | 28 Cr | 13 Cr |
Analysis:
FY25 revenue dropped 29%. PAT down 40%. This is not a growth story — it’s a slow-mo reverse gear.
11. Peer Comparison
| Name | Rev (Cr) | PAT (Cr) | P/E |
|---|---|---|---|
| APL Apollo Tubes | 20,885 | 801 | 58x |
| Welspun Corp | 13,978 | 1,206 | 20x |
| Ratnamani Metals | 5,186 | 541 | 36x |
| Suraj Ltd | 229 | 10 | 66x |
Key Line:
Suraj is like the least drunk guest at a wedding full of finance bros. Same outfit, different balance sheet.
12. Miscellaneous – Shareholding, Promoters
- Promoter Holding: 75% (stable since 2022)
- Public Holding: ~25%
- No. of Shareholders: 2,838 as of June 2025
- FPO/Anchor/M&A Buzz? Zero. The only “buzz” is from the compliance fines.
Management has kept a low profile. Or maybe they’re just hiding behind the tubes.
13. EduInvesting Verdict™
Suraj Ltd is a boutique steel play with niche products, fancy tubes, and a valuation that belongs on a startup pitch deck, not a listed stock.
It’s a decent pit stop for metal exposure. Just don’t expect business class legroom.
Metadata:
Written by EduInvesting Team | July 25, 2025
Tags: Suraj Ltd, Stainless Steel, Analysis, EduInvesting Premium


