1. At a Glance
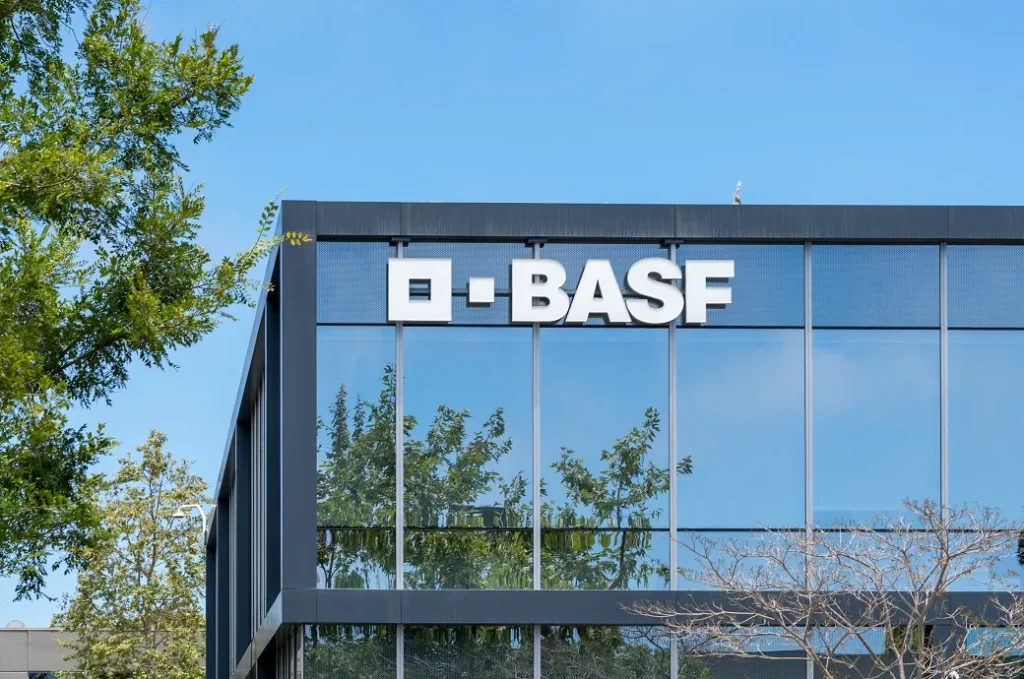
A 110-year-old German giant’s desi avatar is chugging along in India. BASF India, with a ₹21,719 Cr market cap, 17.5% ROCE, and a healthy balance sheet, is a specialty chemicals player that rarely shouts but silently compounds.
But with margins under stress, is this stock still a clean labcoat… or just cleaning out profits?
2. Introduction with Hook
Imagine if your school chemistry lab became a ₹15,000 crore revenue machine — and threw in a ₹20 dividend while it’s at it.
BASF India is:
- The Indian arm of the €60 billion German chemical giant
- Present in everything from agri to automotive to shampoo
- Almost debt-free, but facing cost inflation blues
- Recently demerged its agri-solutions business
And yet, despite all this chemistry, its profit dropped 15% in FY25. So… catalyst or combustion?
3. Business Model (WTF Do They Even Do?)
BASF India operates in 6 segments across materials and molecules:
- Agricultural Solutions (demerged in FY25)
- Materials: Polyurethanes, monomers, plastics
- Industrial Solutions: Performance chemicals
- Surface Technologies: Coatings, automotive finishes
- Nutrition & Care: Personal care ingredients
- Chemicals: Petrochemicals and intermediates
It’s like the Avengers of chemicals. One fights rust, one polishes your car, one grows your food, one stabilises your shampoo.
4. Financials Overview
| Metric | FY24 (₹ Cr) | FY25 (₹ Cr) |
|---|---|---|
| Revenue | 13,767 | 15,260 |
| Operating Profit | 890 | 733 |
| OPM % | 6.5% | 4.8% |
| Net Profit | 563 | 479 |
| EPS (₹) | 130.13 | 110.67 |
| Dividend | ₹20/share | ₹20/share |
Snapshot: Sales grew 11%, profits fell 15%. A classic margin erosion story.
5. Valuation
| Metric | Value |
|---|---|
| Price | ₹5,023 |
| EPS (TTM) | ₹110.67 |
| P/E Ratio | 47.5x |
| Book Value | ₹840 |
| P/B Ratio | 5.98x |
| Dividend Yield | 0.40% |
Fair Value Range Estimate:
| Method | FV Range (₹) |
|---|---|
| Historical PE (30–40x) | 3,300–4,400 |
| PEG-Based (1.2x, 15% growth) | 3,600–4,800 |
| DCF (8% discount, 6% growth) | 4,100–4,600 |
EduInvesting FV Range: ₹3,500 – ₹4,600
Current price ₹5,023? Umm… molecules of optimism priced in already.
6. What’s Cooking – News, Triggers, Drama
- Agricultural Solutions Demerger completed in FY25
- 81st AGM on Aug 12, 2025
- Demand recovery in automotive and construction sectors
- Q4 FY25 profits down sharply due to raw material costs
- Sustainability push in FY25 BRSR filing (Green is in!)
Watchlist triggers:
- Gross margin expansion (pls come back)
- New product launches under BASF parent
- Volume ramp-up post demerger clarity
7. Balance Sheet
| Item | FY24 (₹ Cr) | FY25 (₹ Cr) |
|---|---|---|
| Equity Capital | 43 | 43 |
| Reserves | 3,180 | 3,591 |
| Borrowings | 156 | 190 |
| Other Liabilities | 3,853 | 4,638 |
| Fixed Assets | 759 | 777 |
| CWIP | 61 | 97 |
| Total Assets | 7,233 | 8,462 |
Takeaways:
- Light debt (borrowings < ₹200 Cr)
- Healthy reserve build-up
- Steady capex — not sleeping, not splurging
8. Cash Flow – Sab Number Game Hai
| Type | FY24 (₹ Cr) | FY25 (₹ Cr) |
|---|---|---|
| Cash from Ops | 807 | 373 |
| Cash from Investing | -450 | -114 |
| Cash from Financing | -102 | -129 |
| Net Cash Flow | 255 | 131 |
Observations:
- Operating cash flow halved in FY25 (margin pressure strikes again)
- Lower investing — fewer expansions?
- Still positive net cash, thanks to no debt addiction
9. Ratios – Sexy or Stressy?
| Ratio | FY24 | FY25 |
|---|---|---|
| ROCE (%) | 18% | 17.5% |
| ROE (%) | 14% | 13.4% |
| OPM (%) | 6.5% | 4.8% |
| D/E Ratio | 0.05 | 0.05 |
| Working Capital Days | 45 | 44 |
| CCC (Days) | 21 | 25 |
Verdict: Sexy on capital structure. Stressy on margins.
10. P&L Breakdown – Show Me the Money
| Quarter | Sales (₹ Cr) | OPM % | Net Profit (₹ Cr) |
|---|---|---|---|
| Q1 FY25 | 3,967 | 8% | 221 |
| Q2 FY25 | 4,248 | 5% | 128 |
| Q3 FY25 | 3,759 | 5% | 104 |
| Q4 FY25 | 3,287 | 2% | 27 |
Pattern = Gravity.
From ₹221 Cr to ₹27 Cr. Someone alert Newton.
11. Peer Comparison
| Company | CMP (₹) | P/E | ROCE | OPM % | Yield | PAT (₹ Cr) |
|---|---|---|---|---|---|---|
| Pidilite | 2,965 | 72x | 30% | 22.9% | 0.67% | 2,093 |
| Deepak Nitrite | 1,936 | 38x | 16.6% | 13.2% | 0.39% | 697 |
| Gujarat Fluoro | 3,573 | 72x | 9.8% | 24.4% | 0.08% | 546 |
| Vinati Organics | 1,947 | 49x | 20.6% | 26.0% | 0.36% | 415 |
| BASF India | 5,023 | 47x | 17.5% | 4.8% | 0.40% | 479 |
Conclusion:
Expensive peers, but they offer better margins. BASF is the “safe chemistry” guy at the party.
12. Miscellaneous – Shareholding, Promoters
| Shareholder Type | Mar ’25 |
|---|---|
| Promoter (BASF SE) | 73.33% |
| FIIs | 4.29% |
| DIIs | 6.30% |
| Public | 16.07% |
Trends:
- Strong FII/ DII confidence
- Public holding slowly reducing
- Zero pledge = Zero drama
13. EduInvesting Verdict™
BASF India isn’t a chemical rocket. It’s more of a luxury cruise liner — slow, reliable, and built by Germans.
- Safe balance sheet? Check
- Global parent support? Check
- Profit compression? Also check
It’s a business with legacy and logic — not suited for multibagger maniacs, but great for boring-but-beautiful portfolio builders.
Metadata
– Written by EduInvesting Team | 21 July 2025
– Tags: BASF India, Specialty Chemicals, German Multinational, Demerger, FY25 Earnings
