1. At a Glance
IFB Industries started as a fine-blanking company in 1974 and turned into a domestic appliance ninja. Today, 80% of its revenues come from home appliances like washing machines, dishwashers, and ACs. But with a 47x P/E, can this old-school player still cook up alpha?
2. Introduction with Hook
Imagine your washing machine getting more upgrades than your iPhone. That’s IFB for you — the OG of Indian kitchens that morphed from automotive parts to microwave ovens faster than you can say “Swiss Collaboration.”
- Revenue CAGR (5Y): 14%
- PAT CAGR (3Y): 65%
- ROE (TTM): 16%
- Still no dividend. Because why return cash when you can buy another hob?
3. Business Model (WTF Do They Even Do?)
Split personality much? IFB has two avatars:
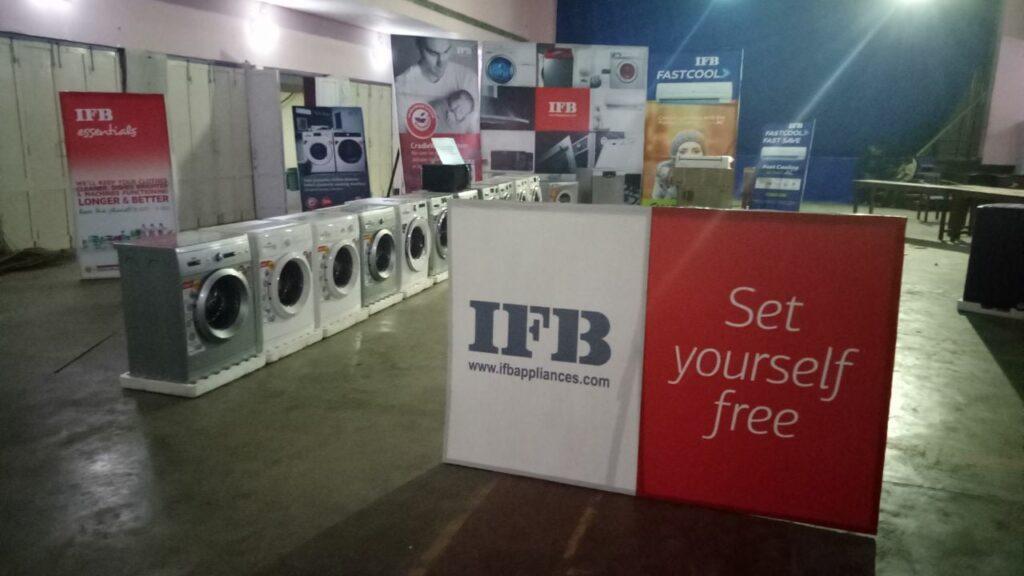
- Home Appliances (80% Revenue):
Washing machines, ACs, dishwashers, modular kitchens, built-in ovens, microwave ovens, and air purifiers. Revenue here grew 13% YoY in 9MFY25. - Fine Blanking & Engineering (20% Revenue):
Supplies precision parts to auto OEMs, but let’s be honest — no one’s here for the gears.
Core USP: Premium but affordable appliances, made in India but inspired by Europe. It operates via a mix of online, offline, and dealer-driven distribution.
4. Financials Overview
(Standalone, ₹ Cr)
| FY | Revenue | EBITDA | Net Profit | OPM % | ROCE % | EPS ₹ |
|---|---|---|---|---|---|---|
| FY23 | 4,104 | 161 | 17 | 4% | 7% | 4.25 |
| FY24 | 4,312 | 211 | 69 | 5% | 13% | 17.00 |
| FY25 | 4,942 | 293 | 129 | 6% | 20% | 31.79 |
Growth is real, but margins still leave much to be desired — especially for a premium brand.
5. Valuation
Current Price: ₹1,511
P/E: 47.6x
Book Value: ₹212 → P/BV = 7.14x
Let’s break it down:
- Base Case FV (25x EPS): ₹795
- Bull Case (40x EPS): ₹1,270
- “Hope is a Strategy” Case (50x EPS): ₹1,585
Fair Value Range: ₹795 – ₹1,270
Market’s already flirting with peak optimism. One margin miss and it’s a rinse cycle.
6. What’s Cooking – News, Triggers, Drama
- FY25 Annual Report filed — AGM coming on July 30. Expect more brand revamp talk.
- Huge push into air conditioners, which are now a growth driver.
- Operating margin improved YoY, thanks to scale and better sourcing.
- Still a debt-heavy balance sheet compared to peers.
- No dividend = no love for income investors.
Bonus drama: Zero dividend payout since listing. What are they saving up for? Buying Whirlpool?
7. Balance Sheet
(₹ Cr)
| Year | Equity | Reserves | Debt | Assets |
|---|---|---|---|---|
| FY23 | 41 | 615 | 348 | 2,072 |
| FY24 | 41 | 685 | 162 | 2,163 |
| FY25 | 41 | 817 | 249 | 2,350 |
Key Points:
- Reserves growing, but debt spiked in FY25.
- Slight decline in CWIP → Capex cycle ending?
- Cash flow from ops: ₹103 Cr in FY25. So yes, washing machines can generate cash.
8. Cash Flow – Sab Number Game Hai
| Year | CFO | CFI | CFF | Net CF |
|---|---|---|---|---|
| FY23 | 107 | -7 | -93 | +7 |
| FY24 | 349 | -140 | -183 | +27 |
| FY25 | 103 | -89 | -22 | -8 |
- FY24 was strong due to operational tailwinds
- FY25 shows tightening cash flows again, mainly due to capex
- Need consistent CFO > PAT — not just appliance sales gimmicks
9. Ratios – Sexy or Stressy?
| Metric | FY23 | FY24 | FY25 |
|---|---|---|---|
| ROCE % | 7% | 13% | 20% |
| ROE % | 2.8% | 11% | 16.2% |
| OPM % | 4% | 5% | 6% |
| Working Cap Days | 7 | -6 | 6 |
| Cash Conv Cycle | -1 | -23 | -1 |
Getting better, but not yet Voltas-level sexy. It’s more like “sturdy middle-class engineering crush.”
10. P&L Breakdown – Show Me the Money
| Year | Revenue | Expenses | EBITDA | Net Profit | EPS |
|---|---|---|---|---|---|
| FY23 | 4,104 | 3,943 | 161 | 17 | 4.25 |
| FY24 | 4,312 | 4,101 | 211 | 69 | 17.0 |
| FY25 | 4,942 | 4,650 | 293 | 129 | 31.79 |
- EBITDA tripled in 2 years
- Net profit grew 7.5x
- They’re finally making more money than a toaster in sleep mode
11. Peer Comparison
| Name | CMP ₹ | P/E | ROCE % | OPM % | Sales (₹ Cr) |
|---|---|---|---|---|---|
| Voltas | 1,376 | 55 | 17.6 | 6.4 | 15,412 |
| Blue Star | 1,828 | 64 | 26.2 | 7.3 | 11,967 |
| Whirlpool | 1,384 | 49 | 13.0 | 6.9 | 7,919 |
| IFB Industries | 1,511 | 47 | 19.8 | 6.0 | 4,942 |
Not bad, but sales scale still lags. IFB is the indie band compared to these AC pop stars.
12. Miscellaneous – Shareholding, Promoters
| Holder | Mar ’25 | Trend |
|---|---|---|
| Promoter | 74.96% | Flat |
| FIIs | 1.06% | ↑ |
| DIIs | 6.41% | ↑ |
| Public | 17.57% | ↓ |
- Promoter holding rock solid.
- FIIs creeping back — they see the cool air.
- 35,000+ shareholders (hello retail army).
13. EduInvesting Verdict™
IFB Industries is your neighborhood appliance samurai — mature, consistent, and (finally) profitable. But trading at 47x earnings in a category dominated by brands with deeper distribution moats and higher margin products?
That’s like buying a dishwasher for ₹90,000 — it better clean your soul, not just your plates.
The story is promising, and growth is tangible. But valuation leaves no room for leaky water filters or operational hiccups.
Metadata
Written by EduInvesting Analyst | 15 July 2025
Tags: IFB Industries, White Goods, Smallcap, Home Appliances, Kitchen Mafia, AC Surge
