1. At a Glance
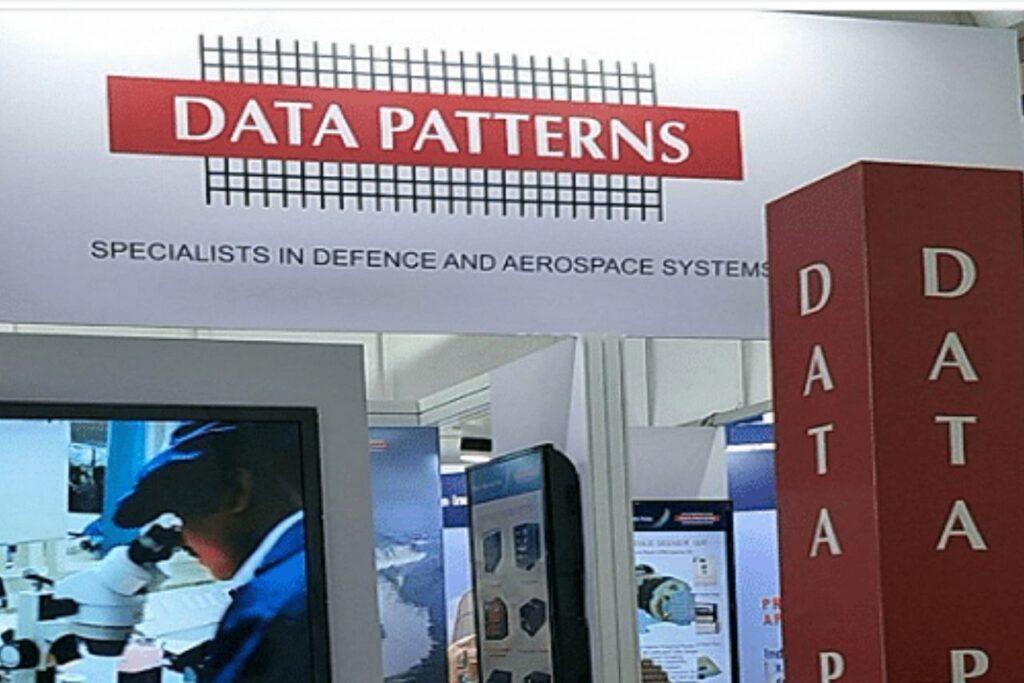
India’s BrahMos brain and Tejas techie, Data Patterns is building the guts of India’s next-gen defence systems—from missiles to satellites—while printing 30%+ EBITDA margins and telling debt to sit down and be quiet.
2. Introduction with Hook
Imagine HAL and BEL had a baby, but this one decided to skip the government hand-holding and go straight into the elite IIT of defence electronics—vertically integrated, highly profitable, and allergic to debt. Data Patterns is not just riding the Make-in-India wave. It’s designing the surfboard, coding the sensors, and monetizing the tide.
- Key Stat 1: 60.4% profit CAGR over 5 years
- Key Stat 2: OPM hovering between 38–50% even in a sector where government billing is considered a patience test.
3. Business Model (WTF Do They Even Do?)
Data Patterns isn’t another contract manufacturer. They’re vertically integrated wizards building:
- Radar systems
- Avionics for Tejas fighter jets
- Embedded systems for missiles
- Satellite payload systems
- Test rigs for submarines, aircrafts, and even space platforms
Basically: if it flies, floats, rolls or explodes in India—Data Patterns probably had something to do with its brains.
They control the entire product lifecycle: Design → Development → Testing → Deployment. No dependency on foreign tech (rare) and no kissing vendor feet.
4. Financials Overview
Profit & Loss (Rs. Cr)
| Year | Sales | EBITDA | EBITDA% | Net Profit | OPM% |
|---|---|---|---|---|---|
| FY21 | 224 | 92 | 41% | 56 | 41% |
| FY22 | 311 | 141 | 45% | 94 | 45% |
| FY23 | 453 | 172 | 38% | 124 | 38% |
| FY24 | 520 | 222 | 43% | 182 | 43% |
| FY25 | 708 | 275 | 39% | 222 | 39% |
Takeaway:
- Profit has tripled in 3 years.
- OPM is a dreamland compared to even BEL or HAL.
- Operating leverage kicking in as revenue scale increases.
5. Valuation
Let’s build a rough DCF / PE comp range:
- FY25 PAT: ₹222 Cr
- Market Cap: ₹15,950 Cr
- Current PE: ~72x
- Industry PE: HAL ~39x, BEL ~56x, Zen Tech ~60x
Valuation Range (FY26 Basis):
- Conservative FV: ₹1,850–₹2,100
- Aggressive FV: ₹3,000–₹3,300
- Current Price: ₹2,849
Verdict: Stock is not cheap. But it’s never been. It’s the Apple of Bharat Electronics.
6. What’s Cooking – News, Triggers, Drama
- CRISIL rating upgraded (Jun 2025): Now A+/Stable, good signal for future project bids.
- Shareholder Count: Crossed 2.2 lakh, retail is paying attention.
- Product pipeline: Systems for LCA Tejas Mk2, space payloads, and more classified goodies.
- FII interest rising: 14.5% → 12.75% (bit of cooling off in 2025, but stable).
7. Balance Sheet
| Item | FY23 | FY24 | FY25 |
|---|---|---|---|
| Equity Capital | ₹11 Cr | ₹11 Cr | ₹11 Cr |
| Reserves | ₹1156 Cr | ₹1313 Cr | ₹1497 Cr |
| Borrowings | ₹2 Cr | ₹4 Cr | ₹6 Cr |
| Cash & Inv. | ₹262 Cr | ₹262 Cr | ₹327 Cr |
| Fixed Assets | ₹112 Cr | ₹150 Cr | ₹284 Cr |
| Total Assets | ₹1,435 Cr | ₹1,692 Cr | ₹1,839 Cr |
Comment: Near debt-free, cash-loaded, and investing in capacity like there’s a space war coming.
8. Cash Flow – Sab Number Game Hai
| Item | FY23 | FY24 | FY25 |
|---|---|---|---|
| CFO (Ops) | -₹17 Cr | ₹139 Cr | -₹90 Cr |
| CFI (Investing) | -₹383 Cr | -₹224 Cr | ₹89 Cr |
| CFF (Financing) | ₹438 Cr | -₹43 Cr | -₹50 Cr |
Takeaway: Huge investments in FY23–FY24. FY25 shows cash strain, possibly due to working capital stuck with defence receivables. But long-term, still solid.
9. Ratios – Sexy or Stressy?
| Ratio | FY23 | FY24 | FY25 |
|---|---|---|---|
| ROCE | 20% | 20% | 22% |
| ROE | 15% | 16% | 16% |
| Debtor Days | 308 | 280 | 307 |
| CCC (Days) | 625 | 759 | 618 |
Yikes: Debtor days are brutal. Defence payments are slow-motion Bollywood songs.
10. P&L Breakdown – Show Me the Money
| Year | Revenue | PAT | EPS | Dividend Payout |
|---|---|---|---|---|
| FY21 | ₹224 Cr | ₹56 Cr | ₹326.86 | 20% |
| FY22 | ₹311 Cr | ₹94 Cr | ₹18.11 | 19% |
| FY23 | ₹453 Cr | ₹124 Cr | ₹22.15 | 20% |
| FY24 | ₹520 Cr | ₹182 Cr | ₹32.45 | 20% |
| FY25 | ₹708 Cr | ₹222 Cr | ₹39.62 | 20% |
Observation: Consistent dividend policy. EPS nearly doubled in 2 years.
11. Peer Comparison
| Company | PE | ROCE | OPM | PAT (TTM) | Market Cap |
|---|---|---|---|---|---|
| HAL | 39x | 33% | 31% | ₹8,359 Cr | ₹3.25 L Cr |
| BEL | 56x | 38% | 29% | ₹5,321 Cr | ₹2.99 L Cr |
| Zen Tech | 60x | 36% | 38% | ₹280 Cr | ₹16.8 K Cr |
| Astra Micro | 61x | 19% | 25% | ₹153 Cr | ₹9.4 K Cr |
| Data Patterns | 72x | 22% | 39% | ₹222 Cr | ₹15.9 K Cr |
Edge: Strong margins + vertical integration = premium justified (somewhat).
12. Miscellaneous – Shareholding, Promoters
| Entity | Jun 2022 | Jun 2023 | Mar 2025 |
|---|---|---|---|
| Promoters | 45.6% | 42.4% | 42.4% |
| FIIs | 1.4% | 7.1% | 12.75% |
| DIIs | 8.2% | 9.5% | 7.3% |
| Public | 44.7% | 40.9% | 37.5% |
- FII love story escalated quickly.
- Retail holding cooling off a bit — maybe due to high valuations.
13. EduInvesting Verdict™
Data Patterns is like that kid who not only topped IIT but also built the satellite for the next ISRO mission during their summer internship.
It’s small compared to HAL and BEL but is quietly eating into their market share, riding on IP-led products, excellent margins, and vertical control. Only risk? Slow-moving defence receivables and lofty valuation.
So if India’s defence sector is the next big thing—Data Patterns isn’t following the trend. It is the trend.
Metadata
– Written by EduInvesting Analyst | 13 July 2025
– Tags: Data Patterns, Defence Stocks, Aerospace, Make in India, India Defence Manufacturing


