1. At a Glance
Manorama Industries Ltd (MIL) is turning forest-floor waste into international gourmet profits. A pioneer in manufacturing cocoa butter equivalents (CBE) and specialty fats from Sal, Mango and other exotic seeds, MIL is a classic case of “Made in India, Consumed by Switzerland.” But is this seed-to-skin empire built to last?
2. Introduction with Hook
Imagine you’re a squirrel in Chhattisgarh. You collect Sal seeds to nibble on. Then comes Manorama — scooping up your stash, processing it, and sending it to Europe to replace cocoa butter in chocolates you’ll never taste. Brutal? Yes. Profitable? Oh, absolutely.
- 3-Year Revenue CAGR: 40%
- FY25 Net Profit: Rs. 112 Cr (up 180% YoY)
- FY25 OPM: 25%, the kind of margins even Marico would envy.
3. Business Model (WTF Do They Even Do?)
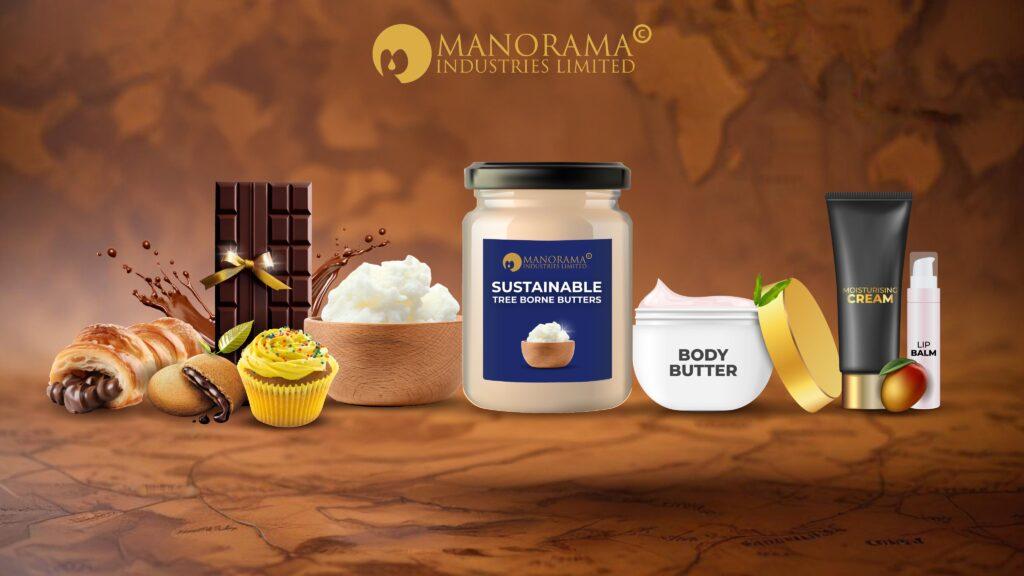
MIL collects wild tree-borne seeds — Sal, Mango kernel, Mahua, etc. — and processes them into high-margin cocoa butter alternatives (CBE), exotic fats, and oleochemicals for food, chocolate, cosmetic and nutraceutical applications.
Verticals:
- Cocoa Butter Equivalent (CBE) — Chocolate Industry
- Specialty Fats & Butters — Confectionery & Skincare
- Fractionated Oils — Pharmaceuticals
- Global markets include: USA, Europe, Brazil, Japan
This is sustainable, waste-to-wealth capitalism done right — with a big fat ESG ribbon on top.
4. Financials Overview
P&L Highlights (FY25):
| Metric | FY22 | FY23 | FY24 | FY25 |
|---|---|---|---|---|
| Revenue (Cr) | 279 | 351 | 457 | 771 |
| EBITDA (Cr) | 39 | 56 | 74 | 191 |
| EBITDA Margin | 14% | 16% | 16% | 25% |
| PAT (Cr) | 24 | 30 | 40 | 112 |
| EPS (Rs) | 4.05 | 5.00 | 6.73 | 18.80 |
From ₹279 Cr in FY22 to ₹771 Cr in FY25. This ain’t linear growth. This is logarithmic lunacy.
5. Valuation
With P/E at 78x, MIL is priced like a skincare unicorn — not a fats exporter. But given the growth trajectory and margin consistency, the market is betting this nutcase has more steam.
Fair Value Range (FY26E):
- DCF-based: ₹1,200–₹1,500
- PE rerating (assuming 50x forward on ₹25 EPS FY26): ₹1,250
Current Price: ₹1,467
Verdict: Valuation is a little nutty. But so is the runway.
6. What’s Cooking – News, Triggers, Drama
- Africa Expansion: Subsidiaries launched in Ghana, Ivory Coast, Togo, Benin, and more.
- Brazil Ops: Subsidiary opened in March 2025 to secure seed sourcing.
- Leadership Shuffle: MD Gautam Pal resigned in Oct 2024 — red flag or succession planning?
Big Bets:
→ Going deeper into value-addition (fractionated oleochemicals)
→ Creating an integrated sourcing-to-manufacturing-to-export supply chain
7. Balance Sheet
| Metric | FY23 | FY24 | FY25 |
|---|---|---|---|
| Equity Capital (Cr) | 12 | 12 | 12 |
| Reserves (Cr) | 286 | 325 | 450 |
| Total Borrowings (Cr) | 110 | 346 | 482 |
| Total Assets (Cr) | 424 | 737 | 985 |
| Net Worth (Cr) | 298 | 337 | 462 |
Key Points:
- Debt has more than quadrupled in 2 years
- But so has EBITDA — hence comfortable coverage
- Equity dilution: None so far, but keep an eye out
8. Cash Flow – Sab Number Game Hai
| Year | CFO (₹ Cr) | CFI (₹ Cr) | CFF (₹ Cr) | Net Cash |
|---|---|---|---|---|
| FY23 | 59 | -99 | -7 | -47 |
| FY24 | -154 | -62 | 214 | -1 |
| FY25 | -59 | -34 | 93 | 0 |
Highlights:
- Free cash flow? LOL, what’s that?
- Heavily investing in capacity and subsidiaries
- Relies on external financing, so interest costs rising
9. Ratios – Sexy or Stressy?
| Metric | FY23 | FY24 | FY25 |
|---|---|---|---|
| ROE | 13% | 13% | 28% |
| ROCE | 13% | 13% | 23% |
| Inventory Days | 272 | 586 | 504 |
| CCC (Days) | 294 | 559 | 539 |
| D/E Ratio | 0.32 | 1.03 | 1.04 |
Interpretation:
ROE and ROCE scream “growth beast.”
But working capital and inventory levels need a strict detox.
10. P&L Breakdown – Show Me the Money
| Metric | FY22 | FY23 | FY24 | FY25 |
|---|---|---|---|---|
| Sales (Cr) | 279 | 351 | 457 | 771 |
| Gross Profit | ~70 | ~90 | ~110 | ~250 |
| EBITDA | 39 | 56 | 74 | 191 |
| Net Profit | 24 | 30 | 40 | 112 |
| EPS (Rs) | 4.05 | 5.00 | 6.73 | 18.80 |
This is the financial equivalent of eating dark chocolate and discovering it has zero sugar.
11. Peer Comparison
| Company | P/E | OPM % | ROCE % | Revenue (Cr) | PAT (Cr) |
|---|---|---|---|---|---|
| Manorama Industries | 78 | 25% | 23% | 771 | 112 |
| EID Parry | 27 | 8% | 17% | 31,608 | 754 |
| Krishival Foods | 64 | 10% | 14.8% | 202 | 13.5 |
| Megastar Foods | 82 | 6% | 8.9% | 350 | 3.7 |
TL;DR: Manorama is the niche luxury chocolate of this sector. Everyone else is a regular Dairy Milk.
12. Miscellaneous – Shareholding, Promoters
- Promoters: 54.42% (down from 57.26%)
- FIIs: 2.81%
- DIIs: 5.14%
- Public: 37.64%
- Shareholders: 19,938 (as of Mar 2025)
Red Flags?
→ Promoter stake has been sliding
→ Working capital ballooning
→ Cash flows inconsistent
But market clearly doesn’t care (yet).
13. EduInvesting Verdict™
Manorama Industries is not your typical FMCG player. It’s a forest-based fats exporter operating at the intersection of sustainability, high margins, and global demand. The company has shown explosive growth, solid ROEs, and cult-like client retention.
But it’s also skating on thin working capital, relying heavily on external funding, and trading at a P/E that assumes perfection.
For Smart Investors: Watch this one closely. It’s a cocoa-fat empire that could melt if inflation, competition, or supply disruptions creep in. But if they pull off their Africa-Brazil-global play without burning cash, Manorama might just be the Swiss chocolate of your portfolio.
Metadata
– Written by EduInvesting | July 13, 2025
– Tags: Specialty Fats, Cocoa Butter, FMCG, Agro Processing, ESG, Chocolate Stocks, Manorama Industries
