1. At a Glance
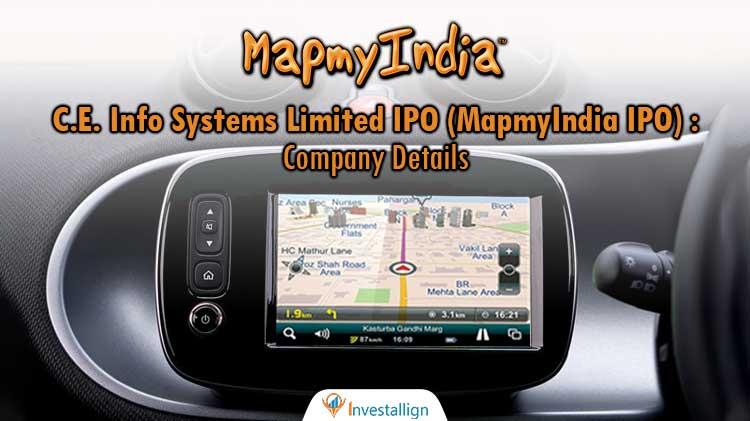
MapmyIndia, the OG desi geotech firm, pioneered digital mapping in India long before Google even learned to spell “turn left.” It’s profitable, asset-light, almost debt-free — and priced like it found a gold mine under your neighborhood kirana store.
2. Introduction with Hook
Imagine Google Maps married a SaaS unicorn and their lovechild only spoke in APIs and satellite coordinates — that’s MapmyIndia.
- Stock PE: 76.5x (Reality or Augmented?)
- ROCE: 24.1% (solid)
- 5-year Profit CAGR: 44.3% (Zooming!)
This company literally sells “location” — and ironically, investors can’t figure out where it belongs in their portfolio.
3. Business Model (WTF Do They Even Do?)
MapmyIndia = Maps + Data + APIs + IoT = Recurring Revenue Mojo.
Product Segments:
- Maps as a Service (MaaS) – Proprietary, hyperlocal maps of India
- SaaS – Fleet management, geospatial analytics, logistics optimization
- PaaS – Developer APIs, location-based SDKs
- IoT & Connected Tech – Devices for vehicles, drones, smart infra
Clients: Automakers, logistics firms, smart cities, BFSI, even defence.
Revenue Style: Long-term annuity contracts + one-time licensing = predictable, scalable.
4. Financials Overview
| Metric | FY25 | FY24 | FY23 |
|---|---|---|---|
| Revenue | ₹463 Cr | ₹379 Cr | ₹281 Cr |
| Operating Profit | ₹176 Cr | ₹155 Cr | ₹118 Cr |
| Net Profit | ₹148 Cr | ₹134 Cr | ₹108 Cr |
| EPS | ₹27.05 | ₹24.77 | ₹19.99 |
| OPM | 38% | 41% | 42% |
Insights:
- Growth has been solid — 65% in top-line since FY23.
- High margins = classic SaaS profile.
- Other Income adds ₹52 Cr to FY25 — worth watching.
5. Valuation
- CMP: ₹1,795
- PE: 76.5x
- PBV: 12.35x
- Book Value: ₹145
Fair Value Estimate (Using DCF, PE normalization, peer benchmarking):
- Bear: ₹1,300 (if growth slows or other income fizzles)
- Base: ₹1,650 (factoring in FY26 growth + moderate re-rating)
- Bull: ₹2,300 (if B2C, EV, and exports take off)
FV Range: ₹1,500 – ₹2,200
Conclusion: Fairly priced for a premium tech story. Not cheap, not outrageous — just premium SaaS wear in khadi.
6. What’s Cooking – News, Triggers, Drama
- Rs 233 Cr order (Jul 2025) – biggest map licensing deal ever.
- Order Book: ₹1,500 Cr+ – solid revenue runway.
- CEO Exit (Mar 2025) – Rohan Verma steps down.
- Acquisitions Spree: SimDaaS, Kaiinos, TerraLink – expansion into AI maps, autonomy & satellite tech.
- Qualcomm Tie-up – automotive navigation & in-car solutions
- Mappls App in 9 Indian languages – aiming for the Bharat market.
7. Balance Sheet
| Item | FY25 | FY24 | FY23 |
|---|---|---|---|
| Equity Capital | ₹11 Cr | ₹11 Cr | ₹11 Cr |
| Reserves | ₹780 Cr | ₹648 Cr | ₹531 Cr |
| Borrowings | ₹30 Cr | ₹26 Cr | ₹29 Cr |
| Total Assets | ₹944 Cr | ₹794 Cr | ₹673 Cr |
Healthy Signs:
- Practically debt-free
- Reserves growing faster than Twitter outrage
- Light capex = cash machine
8. Cash Flow – Sab Number Game Hai
| Type | FY25 | FY24 | FY23 |
|---|---|---|---|
| Operating CF | ₹113 Cr | ₹76 Cr | ₹90 Cr |
| Investing CF | ₹-102 Cr | ₹-59 Cr | ₹-63 Cr |
| Financing CF | ₹-17 Cr | ₹-19 Cr | ₹8 Cr |
| Net Cash Flow | ₹-6 Cr | ₹-3 Cr | ₹36 Cr |
Breakdown:
- Investing in tech & acquisitions
- Positive OCF = recurring model is working
- Financing = mostly dividends and buybacks
9. Ratios – Sexy or Stressy?
| Metric | FY25 | FY24 | FY23 |
|---|---|---|---|
| ROCE | 24.1% | 26% | 25% |
| ROE | 17.6% | 18% | 19% |
| Debt/Equity | ~0.04x | ~0.04x | ~0.05x |
| OPM | 38% | 41% | 42% |
| Cash Conversion Cycle | 31 days | 28 days | 116 days |
Verdict:
Very sexy. Lean, mean, SaaS machine. Minor stress on receivables (Debtor Days: 105), but nothing alarming.
10. P&L Breakdown – Show Me the Money
| Item | FY25 | FY24 | FY23 |
|---|---|---|---|
| Revenue | ₹463 Cr | ₹379 Cr | ₹281 Cr |
| EBITDA | ₹176 Cr | ₹155 Cr | ₹118 Cr |
| Interest | ₹3 Cr | ₹3 Cr | ₹3 Cr |
| Net Profit | ₹148 Cr | ₹134 Cr | ₹108 Cr |
Takeaway:
Healthy core business. Profit not inflated — Other Income helps, but not the driver. YoY growth holding steady.
11. Peer Comparison
| Company | CMP (₹) | PE | ROCE | OPM | Market Cap (Cr) |
|---|---|---|---|---|---|
| Oracle Fin Serv | ₹8,636 | 31x | 40.6% | 44.9% | ₹75,047 |
| Tanla Platforms | ₹632 | 17x | 29.2% | 17.2% | ₹8,509 |
| Nucleus Software | ₹1,159 | 23x | 22.6% | 20.2% | ₹3,103 |
| MapmyIndia | ₹1,795 | 76x | 24.1% | 38% | ₹9,769 |
Commentary:
Premium valuations justified by moat and margins. But any misstep in execution = derating.
12. Miscellaneous – Shareholding, Promoters
- Promoter Holding: 51.65% (stable)
- FII: 4.44% (downtrend from 6.7%)
- DII: 8.91% (increasing confidence)
- Public: ~35%
- Retail Army: 1.56 lakh shareholders
Dividend Policy
- FY25: ₹3.5/share final dividend
- Payout ratio: ~13% – leaves room for reinvestment
B2C Bets:
- Mappls app positioning for EVs, delivery boys, and future drone pizza delivery boys.
13. EduInvesting Verdict™
MapmyIndia is one of those rare SaaS-ish plays with real revenue, real clients, and real India-first tech. It’s not vaporware. It’s not moonshots. It’s maps. Glorious, proprietary, API-packed, revenue-generating maps.
But make no mistake — it’s not cheap. You’re paying premium PE for premium possibilities: EV mapping, AI geospatial, gov infra, drone logistics, and maybe even LLM navigation.
If you like moats, margins, and market monopoly — but can live with bouts of valuation vertigo — this one deserves your coordinates.
Metadata
– Written by EduInvesting | July 14, 2025
– Tags: MapmyIndia, C.E. Info Systems, Geospatial Tech, SaaS, Indian IT Midcaps, Location Intelligence, IoT Mapping, EV Navigation, Qualcomm Partnership, Deep Tech India
Ask ChatGPT


