1. At a Glance
India’s No.1 welding and cutting products manufacturer, Esab India, isn’t just sparking flames in factories — it’s firing up 70% ROCE and printing ₹175 Cr net profit on auto-mode. With global tech backing, zero debt, and a dividend payout policy that would make PSU banks blush, is this industrial OG the smallcap that acts like a largecap?
2. Introduction with Hook
If Warren Buffett was a welder, he’d probably invest in Esab India.
This isn’t your usual smokestack slowpoke. Esab is lean, debt-free, dividend-happy, and growing faster than you’d expect from a company that sells electrode sticks and robotic plasma cutters.
- ROCE: 70%
- FY25 Net Profit: ₹175 Cr
- Operating Margins: 18%
- Dividend Yield: 1.24%, Payout Ratio: 68.8%
This isn’t “growth at reasonable price.” This is “growth at industrial-grade precision.”
3. Business Model (WTF Do They Even Do?)
Esab is the Tata Steel of welding gear — a full-stack welding & cutting solutions company.
Core Offerings:
- Welding Consumables (sticks, wires, fluxes)
- Arc Welding Machines
- Plasma & Oxy-Fuel Cutting
- Welding Automation & Robotics
- Gas Equipment, PPE, and Software
Customer Base:
Steel, shipbuilding, oil & gas, railways, defense, infra — anyone who wants to permanently fuse metal and make it look sexy.
Moat:
- Backed by ESAB Global (now under Enovis/Colfax)
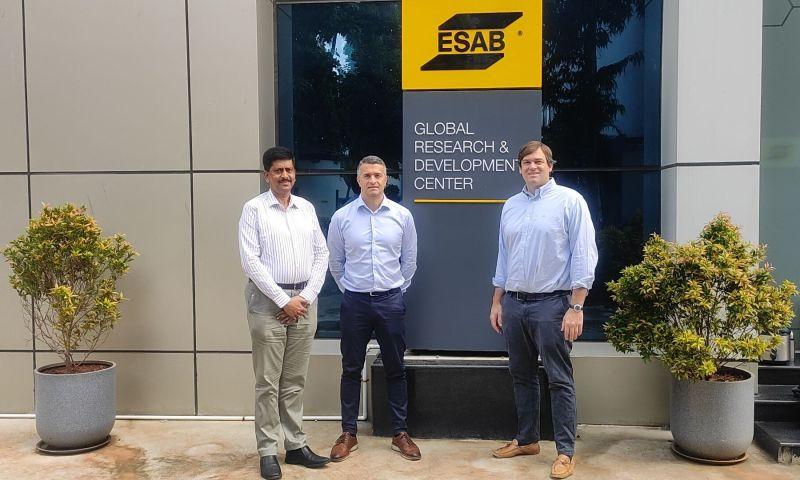
- Deep tech transfer, global R&D, lean ops
- Huge brand recall and massive dealer/service network
4. Financials Overview
FY25 (Standalone):
| Metric | Value |
|---|---|
| Sales | ₹1,373 Cr |
| Operating Profit | ₹245 Cr |
| OPM | 18% |
| Net Profit | ₹175 Cr |
| EPS | ₹113.96 |
| ROCE | 70.3% |
| ROE | 52.6% |
YOY Growth:
- Sales: +10.5%
- Profit: +7.3%
- Margins stable — remarkable in a manufacturing setup
Conclusion:
It’s a textbook example of industrial elegance: capital-light, margin-heavy, and dividend-fueled.
5. Valuation
CMP: ₹5,241
EPS (FY25): ₹113.96
P/E: 46x
Book Value: ₹235
CMP/BV: 22.3x
Valuation Benchmarks:
| Method | Implied Fair Value |
|---|---|
| P/E 35x (sustainable) | ₹3,990–₹4,300 |
| PEG (1x) w/20% EPS growth | ₹4,800–₹5,200 |
| DCF-based (conservative cashflows) | ₹4,500–₹5,100 |
Fair Value Range: ₹4,200 – ₹5,200
Comment: Premium justified — but definitely priced for zero execution errors.
6. What’s Cooking – News, Triggers, Drama
Biggest Sparks Recently:
- ₹2 Cr investment in renewable SPV (solar + wind) for captive power
- Capacity addition of 6,000 metric tonnes
- New R&D facility in pipeline
- Dividend of ₹32/share declared last year
Upcoming:
- August 11, 2025: Q1 Results
- Infra & manufacturing capex tailwinds could push demand
- Automation + PPE verticals = New growth levers
This isn’t a noisy stock — but it’s a silent compounder.
7. Balance Sheet
| Item | FY25 |
|---|---|
| Equity Capital | ₹15 Cr |
| Reserves | ₹346 Cr |
| Total Net Worth | ₹361 Cr |
| Total Borrowings | ₹4 Cr |
| Other Liabilities | ₹282 Cr |
| Total Assets | ₹647 Cr |
Observations:
- Negligible debt (debt/equity ≈ 0.01x)
- Strong reserves position
- Clean, efficient balance sheet with no weird surprises
- Cash-generating asset base — not bloated
8. Cash Flow – Sab Number Game Hai
| Year | CFO | CFI | CFF | Net Cash Flow |
|---|---|---|---|---|
| FY23 | ₹129 Cr | ₹5 Cr | –₹122 Cr | ₹12 Cr |
| FY24 | ₹141 Cr | –₹55 Cr | –₹81 Cr | ₹5 Cr |
| FY25 | ₹199 Cr | –₹15 Cr | –₹157 Cr | ₹27 Cr |
Interpretation:
- Excellent and growing cash from ops
- Controlled capex
- Returns cash to shareholders (dividends, not debt)
This is what free cash flow should look like — solid, rising, and sustainable.
9. Ratios – Sexy or Stressy?
| Ratio | FY25 |
|---|---|
| ROCE | 70.3% |
| ROE | 52.6% |
| OPM | 18% |
| Dividend Payout | 68.8% |
| Debtor Days | 60 |
| Inventory Days | 59 |
| CCC | 31 |
Verdict:
These are Apple-level returns with boring welding sticks.
A finance professor’s dream. Nothing to fix. Just clap.
10. P&L Breakdown – Show Me the Money
| Year | Sales | EBITDA | PAT | EPS |
|---|---|---|---|---|
| FY21 | ₹681 Cr | ₹83 Cr | ₹59 Cr | ₹38.5 |
| FY22 | ₹896 Cr | ₹121 Cr | ₹84 Cr | ₹54.8 |
| FY23 | ₹1,091 Cr | ₹187 Cr | ₹136 Cr | ₹88.1 |
| FY24 | ₹1,243 Cr | ₹228 Cr | ₹163 Cr | ₹105.9 |
| FY25 | ₹1,373 Cr | ₹245 Cr | ₹175 Cr | ₹113.96 |
Trend:
- Steady growth
- Operating leverage kicking in
- Profitability growing faster than revenue — every investor’s fantasy
11. Peer Comparison
| Company | CMP | P/E | ROCE | Sales | PAT | ROE |
|---|---|---|---|---|---|---|
| ESAB India | ₹5,241 | 46x | 70% | ₹1,373 Cr | ₹175 Cr | 52.6% |
| Inox India | ₹1,232 | 50.6x | 38% | ₹1,306 Cr | ₹221 Cr | 29% |
| Subros | ₹926 | 40x | 21% | ₹3,367 Cr | ₹150 Cr | 15% |
| Kirloskar Ind. | ₹4,130 | 30x | 6.7% | ₹6,608 Cr | ₹145 Cr | 2.6% |
Conclusion:
ESAB punches way above its weight in margins, returns, and balance sheet hygiene.
12. Miscellaneous – Shareholding, Promoters
| Shareholder | % Holding |
|---|---|
| Promoters | 73.72% |
| FIIs | 1.79% |
| DIIs | 12.87% |
| Public | 11.60% |
| No. of Shareholders | 20,625 |
Notables:
- Foreign parent = Global tech edge
- Public float is tight
- Institutional interest is rising steadily
13. EduInvesting Verdict™
Esab India: A Blue-Chip in Microcap Clothing
This isn’t some speculative bet — it’s a clean, compounding industrial growth engine. In a sector filled with debt-ridden dinosaurs, Esab runs like a Tesla on espresso: focused, fast, efficient.
What Smart Investors Should Note:
- Premium valuation — deserved, but leaves no margin for error
- Continued automation + green manufacturing = next-gen triggers
- Dividend lovers and quality snobs, this one’s for you
In short:
Esab is industrial capitalism at its sharpest tip — and it welds profits beautifully.
Metadata
– Written by EduInvesting Analyst Team | 13 July 2025
– Tags: Esab India, dividend compounder, welding automation, ROCE kings, capital goods, manufacturing India, smart industrials, high ROE, clean balance sheet, BSE500, NSE:ESABINDIA

