At a Glance
Thyrocare delivered ₹687 Cr in standalone revenue and ₹91 Cr net profit in FY25, with 28% operating margins. ROCE/ROE stand at 25%/16%. Virtually debt-free and sporting a 135% dividend payout, the stock trades at 67× trailing EPS of ₹17.27, implying a fair value range of ₹345–₹432. KMP: Dr A Velumani (CMD) & Deven Amin (CFO).
1. Introduction with Hook
- Once a niche thyroid-test specialist, Thyrocare now processes over 3 billion investigations annually across 929 tests under its Aarogyam banner.
- Yet at a P/E of 67× and 10.5× book, investors are betting big on its diagnostic superpower.
- Is this valuation justified by its growth runway and razor-thin costs, or is it simply a lab rat that’s run out of juice?
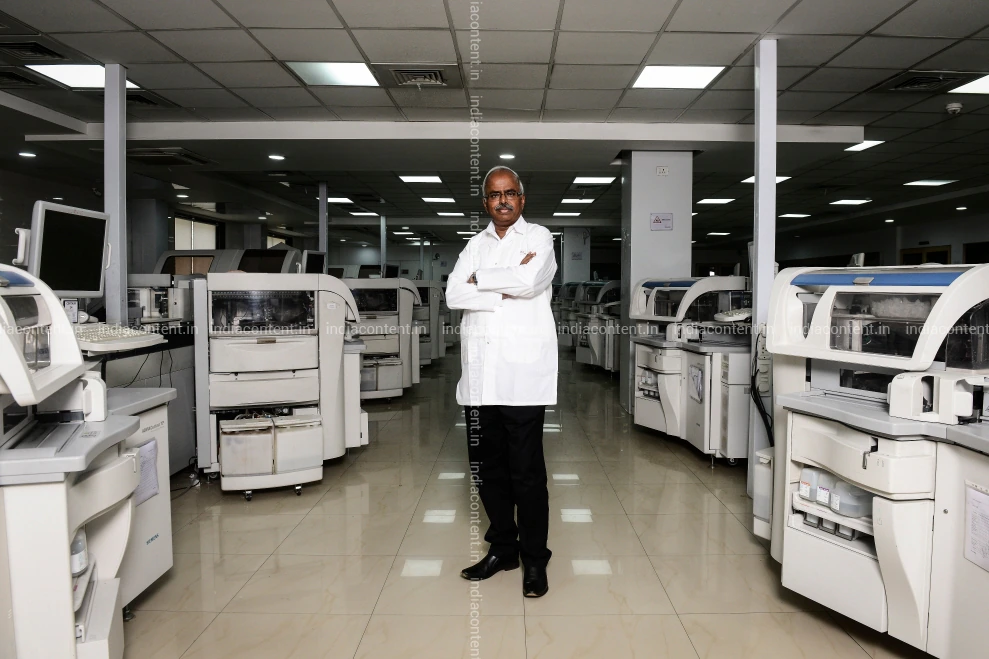
2. Business Model (WTF Do They Even Do?)
- Diagnostic Testing Services (92% of FY25 revenues): Pan-India network of collection centres, high-throughput labs handling preventive health, disease monitoring, and wellness packages.
- Radiology Services (8%): Tie-ups with imaging partners for MRI/CT/X-ray, gradually scaling through partnerships.
- Pricing Advantage: Centralized processing yields cost per test ~₹120 vs. ₹250–400 in local labs.
- Technology Edge: Cloud-based sample tracking, AI-driven quality control, and a franchise model for collection centres.
- Geographic Reach: Over 20,000 collection points covering urban and semi-urban India, with emerging focus on select overseas markets.
3. Financials Overview – Profit, Margins, ROE, Growth
Metric | FY21 | FY22 | FY23 | FY24 | FY25 |
---|---|---|---|---|---|
Revenue (₹ Cr) | 572 | 687 | 589 | 572 | 687 |
Net Profit (₹ Cr) | 69 | 91 | 176 | 69 | 91 |
OPM (%) | 24% | 28% | 40% | 24% | 28% |
ROCE (%) | 18% | 25% | 42% | 18% | 25% |
ROE (%) | 13% | 16% | 33% | 13% | 16% |
- Revenue Resilience: Flattish topline reflects industry maturity; growth fueled by wellness-package uptake.
- Profit Volatility: FY23 spike due to one-offs; normalized to ₹91 Cr in FY25.
- Margins: Operating margins recovered to 28% in FY25 after a mid-cycle dip.
- Returns: ROCE at 25% signals efficient asset use; ROE at 16% underpins capital efficiency despite high dividend payout.
4. Valuation – Is It Cheap, Meh, or Crack?
- Trailing EPS: ₹17.27.
- Current P/E: 66.95×.
- Price/Book: 10.52× book value of ₹103.
- Fair Value Range:
- Conservative (20–25× EPS): ₹345–₹432
- Growth premium (30–35× EPS): ₹518–₹604
- Rationale Transparency:
- Peers trade at 50–70× P/E (Dr Lal Pathlabs at 50×, Vijaya at 73×), .
- Thyrocare’s superior ROCE justifies a premium, but full growth premium band appears priced in.
5. What’s Cooking – News, Triggers, Drama
- JV Equity Infusion: Additional USD 25,000 into Tanzania JV to expand East Africa presence.
- Acquisitions: Completed Polo Labs (₹4.26 Cr) and Vimta Labs (₹7 Cr) transfers, adding niche testing capabilities.
- Tax Rectification: Secured INR 6.67 Cr refund order; faces past-demand challenges of ₹51 Cr for FY17.
- Promoter Pledge: 100% promoter holdings pledged—governance watchpoint despite strong financials.
- Dividend Policy: Maintained high payout (135%) drawing retail loyalty but limiting internal accruals.
6. Balance Sheet – How Much Debt, How Many Dreams?
- Total Liabilities: ₹693 Cr (up from ₹644 Cr), driven by modest borrowings and payables.
- Borrowings: ₹25 Cr vs. ₹42 Cr – virtually debt-free.
- Reserves: ₹494 Cr built on retained earnings.
- Net Debt/Equity: 0.05× – balance sheet armed for opportunistic capex or M&A.
7. Cash Flow – Sab Number Game Hai
Activity | FY24 (₹ Cr) | FY25 (₹ Cr) |
---|---|---|
Cash from Operations | 168 | 191 |
Cash from Investing | –91 | –53 |
Cash from Financing | –85 | –130 |
Net Cash Flow | –8 | +8 |
- Operating Cash: ₹191 Cr in FY25 – robust conversion of profit to cash.
- Capex: ₹53 Cr directed at lab automation and JV funding.
- Financing: ₹130 Cr dividend outflow (135% payout) drove net financing cash out.
8. Ratios – Sexy or Stressy?
Ratio | FY23 | FY24 | FY25 |
---|---|---|---|
Debtor Days | 59 | 28 | 39 |
Inventory Days | 62 | 104 | 89 |
Payable Days | 54 | 88 | 146 |
Cash Conversion Cycle | 67 | 44 | –18 |
- Negative CCC: In FY25, payables lead receivables by 18 days, effectively funding working capital—a cash-flow boon.
- Efficiency: Rapid collections (39 days) and vendor credit extend margin cushion.
9. P&L Breakdown – Show Me the Money
- Revenue Mix FY25:
- Diagnostic Tests: 92%
- Imaging Tie-ups: 8%
- Cost Structure:
- Consumables & Lab Ops: ~40% of sales
- Employee & Admin: 20%
- Rent & Utilities: 8%
- Other Overheads: 4%
- Gross Margin: ~60%
10. Peer Comparison – Who Else in the Game?
Company | CMP (₹) | P/E | ROCE (%) | Dividend Yield |
---|---|---|---|---|
Dr Lal Pathlabs | 2,926.5 | 50.1 | 28.9 | 0.82% |
Vijaya Diagnostic | 1,020.5 | 72.9 | 21.7 | 0.10% |
Metropolis Health | 1,885.3 | 67.4 | 14.8 | 0.21% |
Thyrocare | 1,085.5 | 67.0 | 24.8 | 1.93% |
- Takeaway: Thyrocare sits mid-pack on valuation but leads on ROCE and dividend yield, reflecting capital efficiency and shareholder returns.
11. Miscellaneous – Shareholding, Promoters
- Promoters: 71.06% (100% pledged) – governance risk despite strong performance.
- FIIs: 2.41% (minimal).
- DIIs: 14.97% (steady support).
- Public Float: ~11.6%.
- KMP:
- Dr A Velumani – Founder & CMD
- Deven Amin – CFO
12. EduInvesting Verdict™
Thyrocare’s lean, high-margin model and negative cash-conversion cycle make it a diagnostic marvel. Yet at 67× earnings and full promoter pledges, much of its capital-efficiency story is already in the price. The fair value zone of ₹345–₹432 suggests limited upside without new growth levers—consider the lab rat’s sprint paced by rigorous competition and capital constraints.
✍️ Written by Prashant | 📅 July 12, 2025
Tags: Thyrocare Technologies, Diagnostics, Healthcare Services, Stock Analysis, EduInvesting Verdict