At a Glance
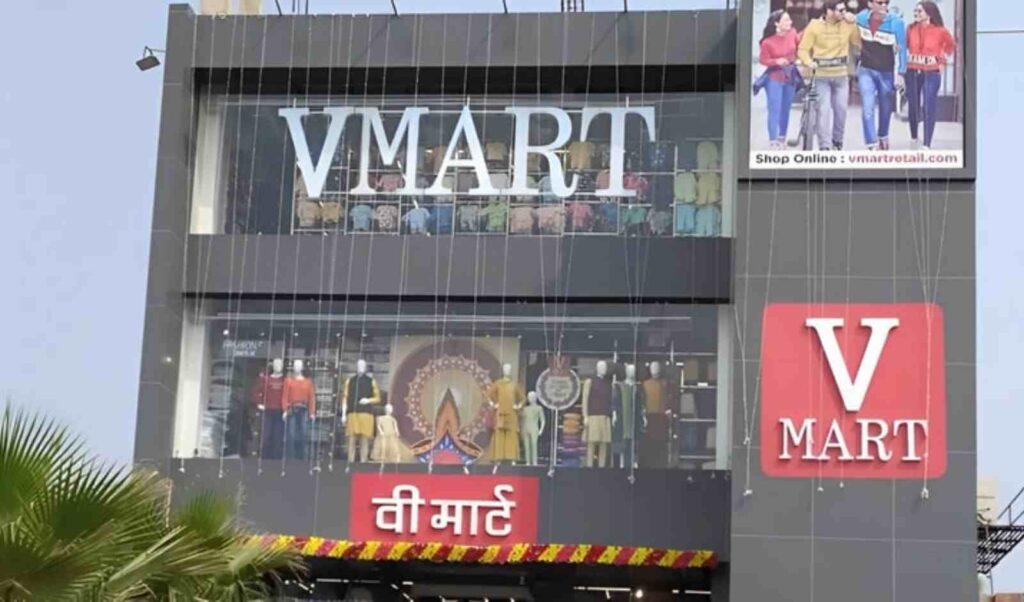
V-Mart operates 488 “value retail” stores across India’s tier-II to IV towns, delivering ₹3,254 Cr in revenues and ₹46 Cr in net profit for FY25. ROCE/ROE stand at 8.5%/3.1%. With virtual debt relief and a 3:1 bonus in May ’25, the stock trades at 253× trailing EPS of ₹5.78.
1. Introduction with Hook
- Retailers love tier-I glamour; V-Mart chases tier-III bargains—488 stores deep.
- FY25 saw revenues hit ₹3,254 Cr, but profit lingered at ₹46 Cr, giving a P/E of 253×.
- Before you add to cart, let’s unpack margins, working-capital feats, and whether this “value” stock is truly on sale or just overpriced.
2. Business Model (WTF Do They Even Do?)
- Value Apparel & Accessories: Core is private-label and regional brands across apparel, footwear, accessories.
- Kirana Bazaar: Mini grocery sections augment footfall in semi-urban markets.
- Target Markets: ~80% stores in tier-II–IV cities, where organized retail penetration is <10%.
- Omnichannel Push: Modest e-commerce integration to boost loyalty programs and data analytics.
- Balance: Low-rent footprints and lean staffing aim to offset thinner rural margins.
3. Financials Overview – Profit, Margins, ROE, Growth
| Metric | FY21 | FY22 | FY23 | FY24 | FY25 |
|---|---|---|---|---|---|
| Sales (₹ Cr) | 1,075 | 1,666 | 2,465 | 2,786 | 3,254 |
| Net Profit (₹ Cr) | –6 | 12 | –8 | 46 | 46 |
| OPM (%) | 12% | 12% | 8% | 8% | 12% |
| ROCE (%) | 4% | 5% | 5% | 1% | 8.5% |
| ROE (%) | –1% | 1% | –3% | 3% | 3.1% |
- Sales Growth: 5-year CAGR ~14%—solid for a bricks-and-mortar roll-out.
- Profit Yo-Y: FY24 turned profitable at ₹46 Cr and held steady in FY25.
- Margins: Operating margins rebounded from 8% to 12% post bonus issue and expense control.
- Returns: ROCE improved to 8.5% as leased-capex normalized; ROE still mop-up phase after equity base hike.
4. Valuation – Is It Cheap, Meh, or Crack?
- Trailing EPS: ₹5.78 (Standalone FY25).
- Current P/E: 253×.
- Price/Book: 7.48× book value of ₹102.
- Fair Value Range:
- Conservative (25–30× EPS): ₹145–₹173.
- Growth premium (35–40× EPS): ₹202–₹231.
- Takeaway: At ₹765, shares trade >3× even the high-growth fair band—suggesting lofty expectations baked in.
5. What’s Cooking – News, Triggers, Drama
- 3:1 Bonus Issue: May 2, 2025—rewarded shareholders but doubled equity base, diluting per-share metrics.
- 500th Store Milestone: April 11, 2025—store count crossing 500 could unlock scale economies.
- Bonus vs. Dividend: No dividend declared for FY25—cash redeployed into expansion.
- Labour Act Orders: Multiple small penalties (₹5–10 Lakh range) under Minimum Wages Act—minor P&L blips but governance spotlight.
6. Balance Sheet – How Much Debt, How Many Dreams?
- Total Liabilities: ₹2,436 Cr down from ₹2,845 Cr (FY24)—working-capital release post festive season.
- Borrowings: ₹783 Cr vs. ₹1,391 Cr—₹608 Cr debt reduction through internal accruals.
- Reserves: ₹790 Cr—built up from retained earnings.
- Net Debt/Equity: ~0.99×—still leveraged but improving.
7. Cash Flow – Sab Number Game Hai
| Activity | FY24 (₹ Cr) | FY25 (₹ Cr) |
|---|---|---|
| Cash from Operations | 386 | 349 |
| Cash from Investing | –118 | –122 |
| Cash from Financing | –259 | –215 |
| Net Cash Flow | +9 | +12 |
- Operating Cash: Comfortable ₹349 Cr—supports capex and debt servicing.
- Capex: ₹122 Cr mainly for store refits and new outlets.
- Financing: Net outflow as debt repayments outpaced new borrowings.
8. Ratios – Sexy or Stressy?
| Ratio | FY23 | FY24 | FY25 |
|---|---|---|---|
| Inventory Days | 224 | 163 | 169 |
| Payable Days | 127 | 85 | 80 |
| Cash Conversion Cycle | 126 | 36 | 39 |
| Working Capital Days | 89 | 40 | 40 |
- CCC Turnaround: Collapsed from 126 to 39 days via leaner inventory and faster payables—a working-capital masterstroke.
9. P&L Breakdown – Show Me the Money
- Revenue Mix FY25:
- Apparel & Fashion: 70%
- Non-Apparel (Footwear, Decor): 20%
- Kirana Bazaar: 10%
- Cost Structure:
- Store Rent & Utilities: 18% of sales
- Employee Expenses: 10%
- Merchandise Costs: 60%
- Other Overheads: 12%
10. Peer Comparison – Who Else in the Game?
| Company | CMP (₹) | P/E | ROCE (%) |
|---|---|---|---|
| Avenue Supermarts | 4,064 | 97.7 | 18.0 |
| Vishal Mega Mart | 133.6 | 98.6 | 13.1 |
| Shoppers Stop | 511.5 | 532.7 | 7.96 |
| V-Mart Retail | 765.2 | 253.4 | 8.5 |
- Takeaway: V-Mart’s P/E is 2–3× higher than peers despite lower return ratios—a valuation outlier.
11. Miscellaneous – Shareholding, Promoters
- Promoters: 44.28% (steady control).
- FIIs: 17.48% (rising interest).
- DIIs: 32.93% (consistent support).
- Public Float: ~5.33% (tight free float).
- KMP:
- Lalit Agarwal – Managing Director
- Sandeep Teotia – Chief Financial Officer
12. EduInvesting Verdict™
V-Mart’s blitz into India’s hinterland has sparked revenue growth and CCC wizardry, but profits remain a molehill under a mountain of expectations. With a P/E north of 250×, much of the expansion story is already priced in—any hiccup in consumer demand or store economics could leave shareholders holding a clearance basket.
✍️ Written by Prashant | 📅 July 12, 2025
Tags: V-Mart Retail, Retail Analysis, Value Retail, Stock Valuation, EduInvesting Verdict


