1. At a Glance
• 5-year sales CAGR: 382% (to ₹ 1,488 cr)
• 5-year profit CAGR: 156% (to ₹ 57 cr)
• ROCE: 7%; ROE: 3%
• P/E (FY25 EPS ₹ 0.45): 202×
• Fair‐value range (15–20× EPS): ₹ 6.75–₹ 9.00
2. Introduction with Hook
Lloyds Enterprises started as plain-vanilla iron-and-steel trader, but over 5 years it has morphed into a ₹ 1,488 cr behemoth—complete with warehousing dreams and gold-mine stakes. Yet at ₹ 90.7/share (202× earnings), the market’s betting on a commodities coup rather than a mere trading tale.
3. Business Model (WTF Do They Even Do?)
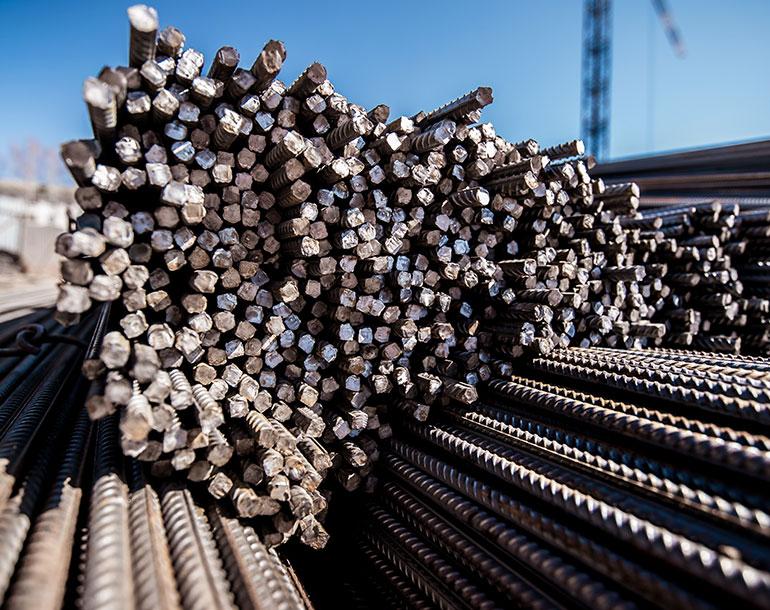
- Core: Bulk trading of iron & steel products across India.
- Backward Link: Lloyds Realty Developers signs MoU for 99-acre Taloja logistics park—aims to own the supply chain end-to-end.
- Diversification: Investing ₹ 140 cr for a 31.6% stake in a gold-mining venture—because why stop at steel?
- Growth Levers: Higher volumes, logistics margin, and other-income sweeteners (₹ 82.6 cr in FY25).
4. Financials Overview – Profit, Margins, ROE, Growth
| Metric | FY20 | FY25 | 5-Yr CAGR |
|---|---|---|---|
| Sales (₹ cr) | 303¹ | 1,488 | +382% |
| Net Profit (₹ cr) | 22¹ | 57 | +156% |
| OPM (%) | 8% | 5% | –3 pp² |
| ROCE (%) | 2% | 7% | +5 pp |
| ROE (%) | 1% | 3% | +2 pp |
¹ Approximate values derived from 5-year growth rates.
² Margins compressed as trading volumes climbed faster than higher-margin ventures.
5. Valuation – Is It Cheap, Meh, or Crack?
- EPS FY25: ₹ 0.45
- Current P/E: 202× (₹ 90.7/₹ 0.45)
- Fair‐Value Band (15–20× EPS):
- Low end: 15 × ₹ 0.45 = ₹ 6.75
- High end: 20 × ₹ 0.45 = ₹ 9.00
- Verdict: At ~₹ 90, you’re paying for a trading house to become a logistics and gold-mining conglomerate—expectation inflation ahead of actual execution.
6. What’s Cooking – News, Triggers, Drama
- Taloja Logistics Park (MoU): Lloyds Realty to acquire 51% in CLPL for ₹ 60 cr and fund ₹ 242 cr debt—logistics ambition going industrial (Jul 2025).
- Gold-Mining Bet: ₹ 140 cr for 31.6% stake—if gold flows, other-income could morph from drop to deluge.
- Volume Alert: Debtor days up from 54 to 67, hinting at extended customer credit—and stretched working-capital.
7. Balance Sheet – How Much Debt, How Many Dreams?
- Borrowings: ₹ 596 cr (up from ₹ 125 cr FY24), financing logistics and mining stakes.
- Reserves: Swelled to ₹ 2,327 cr from ₹ 1,538 cr, absorbing volatility.
- Liabilities: Total ₹ 4,257 cr vs ₹ 2,406 cr last year—balance‐sheet bulge mirrors ambition.
- Fixed Assets: Jumped to ₹ 254 cr from ₹ 109 cr—initial capex for warehouses and plants.
8. Cash Flow – Sab Number Game Hai
| Cash Flow Type | FY24 (₹ cr) | FY25 (₹ cr) |
|---|---|---|
| Operating CF | +145 | – |
| Investing CF | –295 | – |
| Financing CF | +140 | – |
| Net Cash Flow | –10 | ex-MoU moved to Q2 |
• Operating cash saw a surprise jump on other-income heavy quarters.
• Investing outflows reflect gold-mine capex and park development.
• Financing filled the gap, raising fresh debt and share capital.
9. Ratios – Sexy or Stressy?
| Ratio | FY20 | FY25 |
|---|---|---|
| Debtor Days | 54 | 67 |
| Inventory Days | 1,552³ | 51 |
| Payable Days | 274 | 34 |
| Cash Conversion Cycle (d) | 1,357 | 85 |
| Working-Cap Days | 826 | 235 |
³ FY20 spike due to near-zero revenue base.
Takeaway: Early chaos in working‐cap metrics has calmed, but elevated debtor days remain a drag.
10. P&L Breakdown – Show Me the Money
- Revenue Streams FY25:
- Trading: ~90% of sales
- Other Income: ₹ 82.6 cr (non-recurring boost)
- Cost Structure:
- Procurement cost ~93% of sales
- Operating & admin ~2%
- Interest & Depreciation: ~₹ 20 cr combined—minor relative to turnover.
11. Peer Comparison – Who Else in the Game?
| Company | CMP (₹) | P/E | ROCE | MCap (₹ cr) |
|---|---|---|---|---|
| Nupur Recyclers | 78 | 37 | 19 | 539 |
| Mangalam Worldwide | 166 | 18 | 14 | 494 |
| Lloyds Enterprises | 91 | 202 | 7 | 11,516 |
| ABans Enterprise | 30 | 11 | 12 | 208 |
| Chennai Ferrous | 121 | 11 | 11 | 44 |
Insight: Lloyds commands microcap scale but trades at hyper-multiple—peer P/Es <40× highlight the market’s lofted growth hopes here.
12. Miscellaneous – Shareholding, Promoters & KMP
- Promoters: 73.91% (up from 60.9% in 2022)
- FIIs/DII: <0.5% and <0.1%, respectively—retail-heavy register.
- Public: ~25.5%
- KMP News: No major management churn, but board approvals for major capex noted in July 2025 filings.
13. EduInvesting Verdict™
Lloyds Enterprises has sprinted from humble trader to logistics-and-mining hopeful in five years—yet the price tag (202× earnings!) bakes in twice the fair-value comfort zone. Execution risk looms large: if warehouses stall or gold veins run dry, those sky-high multiples could deflate as swiftly as they inflated.
✍️ Written on July 12, 2025
Tags: Lloyds Enterprises Ltd, 5-Year Recap, Iron & Steel Trading, Logistics Park, Gold Mining, Fair Value, Financial Analysis
