1. At a Glance
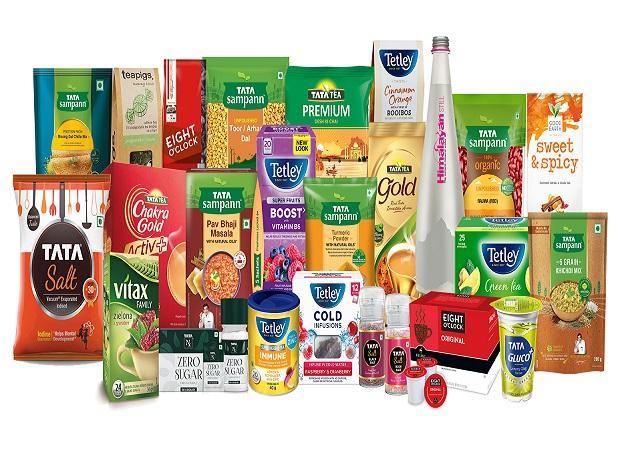
Tata Consumer (₹1,077) is the ₹1.06 lakh Cr FMCG juggernaut owning Tata Tea, Tetley, Tata Salt, Himalayan water and more. In the last five years, sales grew at 13% CAGR, profits at 15% CAGR—but trading at 84× P/E vs. peer median ~18× feels like paying Gucci rates for gaajar ka halwa. Fair‐value range: ₹210–260.
2. Introduction with Hook
You walk into your neighbourhood adda and brag about “diversified FMCG.” Everyone nods. Then you mention “84× P/E” and they laugh—at you. Tata Consumer has been on a valuation bungee jump with no cord. Sure, they own your salt, tea, coffee and that fancy Himalayan water you sip when pretending to ‘detox’—but are they worth this hype or simply steeping investors in hot air?
3. Business Model (WTF Do They Even Do?)
- Tea & Coffee: Tata Tea, Tetley (global), Eight O’Clock Coffee (USA)
- Salt & Staples: Tata Salt (#1 in India), Tata Sampann pulses/spices
- Beverages: Himalayan mineral water
- Health Foods: Organic India (100% subsidiary since Dec ’24)
- Global Footprint: Present in 40+ countries, #2 tea co. globally
4. Financials Overview – Profit, Margins, ROE, Growth
| Metric | FY21 | FY22 | FY23 | FY24 | FY25 | 5 Y CAGR |
|---|---|---|---|---|---|---|
| Revenue (₹ Cr) | 11,602 | 12,425 | 13,783 | 15,206 | 17,618 | 13% |
| Net Profit (₹ Cr) | 930 | 1,015 | 1,320 | 1,215 | 1,287 | 15% |
| OPM (%) | 13% | 14% | 13% | 15% | 14% | – |
| ROE (%) | 8.9% | 9.8% | 12.5% | 11.6% | 12.9% | 7% |
- Takeaway: Growth is steady—not spectacular.
5. Valuation – Is It Cheap, Meh, or Crack?
- Current P/E: 84.4×
- Peer Median (FMCG): ~18×
- FV Calc (FY25 EPS ₹12.92):
- Low (16×) → ₹206
- High (20×) → ₹258
- At ₹1,077? You’re paying ~4× the high band. Over-caffeinated much?
6. What’s Cooking – News, Triggers, Drama
- Organic India acquisition (Dec ’24) adds “health foods” cred—but niche volume
- ₹3,000 Cr rights issue (Jul ’24) funded capex; diluted retail?
- Sunil D’Souza re-appointed CEO (Feb ’25)—promises “aggressive growth”
- Input costs rising: tea leaf inflation & packaging price bump
7. Balance Sheet – How Much Debt, How Many Dreams?
| Item | Mar ’24 | Mar ’25 | Δ |
|---|---|---|---|
| Borrowings (₹ Cr) | 3,477 | 2,393 | –31% |
| Equity+Reserves | 17,942 | 20,001 | +11% |
| Debt/Equity | 0.19× | 0.12× | Healthier |
- Note: Low leverage, but capex spree needs ROI.
8. Cash Flow – Sab Number Game Hai
| Activity | FY24 | FY25 |
|---|---|---|
| Ops Cash (₹ Cr) | 1,937 | 2,057 |
| Invest (₹ Cr) | –1,911 | –2,303 |
| Finance (₹ Cr) | 256 | 453 |
| Free Cash Flow | 26 | –246 |
- Insight: Negative FCF in FY25—capex burns cash despite rights issue.
9. Ratios – Sexy or Stressy?
- ROCE: 11% → 9%
- Current Ratio: 1.1×
- Inventory Days: 152 (vs. 140)
- Cash Cycle: 22 days (best in 5 years)
10. P&L Breakdown – Show Me the Money
- Gross Margin: ~37% (stable)
- SG&A/Sales: ~23% (ramping distribution)
- Other Income: volatile (–₹81 Cr → +₹188 Cr)
- Tax Rate: ~23%
11. Peer Comparison – Who Else in the Game?
| Co. | P/E | ROE (%) | Div Yld (%) |
|---|---|---|---|
| Tata Consumer | 84.4× | 12.9% | 0.77% |
| Britannia Ltd | 48× | 25% | 1.1% |
| Dabur India | 60× | 18% | 1.5% |
| ITC Ltd | 25× | 18% | 2.3% |
| Median FMCG | 18× | 15% | 1.2% |
- Callout: Tata trades at mega-premium but lags peers on RoE & yield.
12. Miscellaneous – Shareholding, Promoters
- Promoter: 33.84% (no pledges)
- FII: 21.5% ↑
- DII: 22.0% ↑
- Public Float: ~22.7%
13. EduInvesting Verdict™
- Valuation: Over-steeped ☕—84× P/E vs. ₹210–260 fair
- Growth: Steady, not spectacular
- Risks: Input‐cost inflation, negative FCF, volatile ancillary income
- Mood: Meh—not worth the hype; better bargains in FMCG aisle
(Zero buy/sell calls—just cold chai facts.)
✍️ Written by Prashant | 📅 July 12, 2025
Tags: Tata Consumer, FMCG, Fair Value, EduInvesting, Tea Stocks, Tata Tea, Tata Salt


