At a Glance
MBAPL has delivered blockbuster TTM revenue of ₹1,269 Cr and PAT of ₹74 Cr, but margin pressure and a steep valuation (~50x P/E) raise eyebrows. With 90%+ promoter holding, Ostwal Group’s fertiliser flagship is expanding capacity. But does it deserve the current hype?
1. 🎬 Introduction with Hook
MBAPL ka share toh literally double ho gaya in 12 months, but here’s the twist — you’re paying 9.1x book for a single-digit margin fertiliser company that literally sells “Annadata SSP”.
From ₹197 lows to ₹420 today, it’s the kind of move that turns your CA uncle into a chartist. But behind the breakout: is there sustainable business power… or just commodity fertilizer pump?
2. 🧬 WTF Do They Even Do?
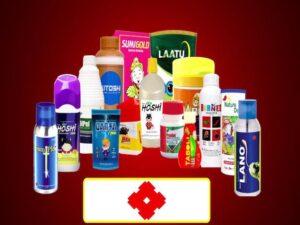
- 💊 Core Business: Manufacturing Single Super Phosphate (SSP), NPK, and other phosphatic fertilisers.
- 🧪 Chemicals Arm: Also does sulphuric acid, oleum, and allied chemicals.
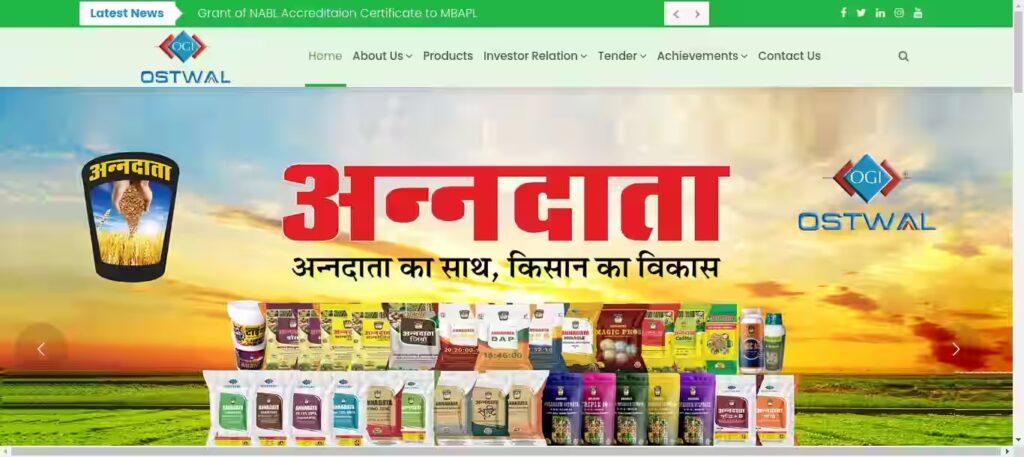
- 🧭 Brands: ‘Annadata’ for SSP and ‘Bharat’ for NPK/DAP products.
- 🧱 End Use: Used primarily by farmers for phosphate enrichment of soil in India.
Bonus Trivia: SSP demand in India is cyclical and subsidy-dependent. MBAPL operates with strong state-level penetration and backward integration of raw materials.
3. 💰 Financials Overview – Profit, Margins, ROE, Growth
| Metric | FY23 | FY24 | TTM |
|---|---|---|---|
| Revenue | ₹981 Cr | ₹1,059 Cr | ₹1,269 Cr |
| Net Profit | ₹124 Cr | ₹57 Cr | ₹74 Cr |
| OPM % | 21% | 14% | 13% |
| ROE % | 30% | 12% | 15% |
📉 The Real Story:
- FY23 was a dream year. Margin at 21%, ROE 30%.
- FY24 and TTM margins have shrunk to 12–14%.
- Despite higher sales, profit fell ~50% in FY24.
4. 💸 Valuation – Cheap, Meh, or Crack?
| Metric | Value |
|---|---|
| P/E (TTM) | 49.6x |
| P/B | 9.1x |
| Market Cap | ₹3,677 Cr |
| Fair Value Range (EduInvesting) | ₹280–₹330 |
🧮 FV Logic:
- Applying 18x–21x P/E (Sector Median ~28x, but peers like Chambal trade at 13x) to normalized EPS of ₹14–₹16 = FV Range ₹280–₹330.
- At ₹420, stock is trading at a 50%+ premium to optimistic fair value.
5. 🍳 What’s Cooking – News, Triggers, Drama
- 📈 Q1 FY26 Revenue at ₹409.7 Cr, PAT ₹28.2 Cr – Highest ever!
- 🏭 Capacity Expansion ongoing – adding new lines in Rajasthan.
- 🌾 New Product launches underway in sulphur and NPK category.
- 🧱 Land Acquired for greenfield chemical unit – hints at vertical expansion.
🚩 But… management hasn’t clarified timelines or funding for expansion. And margins haven’t fully recovered post FY23.
6. 🏦 Balance Sheet – How Much Debt, How Many Dreams?
| Item | Mar 2025 |
|---|---|
| Equity Capital | ₹88 Cr |
| Reserves | ₹316 Cr |
| Total Borrowings | ₹318 Cr |
| Total Assets | ₹946 Cr |
- 🧾 Debt-to-Equity: ~0.95x – manageable but nearing risk zone.
- 🧱 Capex-heavy model with ₹74 Cr in CWIP already.
- 🧮 Company has funded growth via internal accruals + borrowings, no equity dilution yet.
7. 💵 Cash Flow – Sab Number Game Hai
| Year | CFO | FCF |
|---|---|---|
| FY23 | ₹(70) Cr | Negative |
| FY24 | ₹149 Cr | Moderate |
| FY25 | ₹96 Cr | Still okay-ish |
- CFO has swung wildly, thanks to working capital cycles.
- Inventory + receivables rise = negative operating cash in peak FY23 growth phase.
- FY25 CFO ₹96 Cr is healthy but capex absorption remains a challenge.
8. 📉 Ratios – Sexy or Stressy?
| Metric | Value |
|---|---|
| ROCE (TTM) | 18% |
| ROE (TTM) | 15.2% |
| OPM (Q1FY26) | 14% |
| Debtor Days | 88 days |
| Inventory Days | 85 days |
| CCC | 125 days |
- ROCE above 15% is decent, but OPM <15% keeps stress elevated.
- Working capital cycle is long (125 days), affecting liquidity.
9. 🧾 P&L Breakdown – Show Me the Money
- Q1 FY26:
- Revenue ₹409.7 Cr
- Net Profit ₹28.2 Cr
- EPS ₹3.22
- OPM improved vs FY24.
- Trendline:
- FY23: ₹981 Cr rev / ₹124 Cr PAT
- FY24: ₹1,059 Cr rev / ₹57 Cr PAT
- TTM: ₹1,269 Cr rev / ₹74 Cr PAT
So, company is scaling, but not profiting at the same rate.
10. 🧯 Peer Comparison – Who Else in the Game?
| Company | P/E | ROCE | OPM | CMP/BV | ROE |
|---|---|---|---|---|---|
| Coromandel | 39.9x | 23.2% | 10.7% | 6.18x | 16.8% |
| Chambal Fert. | 13x | 27.9% | 14.9% | 2.46x | 20.6% |
| Paradeep | 24x | 13.9% | 9.1% | 3.29x | 14.4% |
| GSFC | 13.6x | 6.2% | 6.6% | 0.66x | 4.8% |
| MBAPL | 49.6x | 18.0% | 13.3% | 9.1x | 15.2% |
🤔 Despite decent ROCE, MBAPL looks overvalued vs all peers. Chambal is half the P/E with similar margins and better brand recall.
11. 🧿 Miscellaneous – Shareholding, Promoters
| Category | Mar 2025 |
|---|---|
| Promoters | 74.56% |
| Public | 25.41% |
| FIIs | 0.03% |
- Stable promoter holding – Ostwal Group is all-in.
- No major FII or DII interest (yet).
- 8,966 shareholders – mostly retail-dominated, possible HNI + SME-style momentum.
12. 🧠 EduInvesting Verdict™
🚩 This is not a buy/sell reco. This is fertilizer drama.
MBAPL has:
- 💹 Good scale
- 📉 Shrinking margins
- 🧾 Manageable debt
- 📈 Ambitious expansion
But…
- You’re paying premium valuation for an average-margin business.
- FY23 was peak. TTM looks like consolidation.
- Unless margins return to 20%+ levels, P/E 50x is crack.
At ₹420, this is a fine example of: “great execution, but even better hype.”
🧮 Fair Value Range: ₹280–₹330 (18x–21x EPS of ₹14–₹16)
✍️ Written by Prashant | 📅 11 July 2025
Tags: MBAPL, Ostwal Group, Fertilizer Stocks, Agrochemicals, NPK, SSP, Madhya Bharat Agro, High PE Stock, EduInvesting, Q1FY26 Results, Indian Fertiliser Industry, Valuation Overhype, Midcap Stocks
