🧵 V2 Retail: From Vishal Megamart to V2 Mega Run – What’s Behind the ₹6,799 Cr Fashion Frenzy?

🧵 V2 Retail: From Vishal Megamart to V2 Mega Run – What’s Behind the ₹6,799 Cr Fashion Frenzy?

🟨 1. At a Glance

Once left for dead post its “Vishal Megamart” crash landing, V2 Retail has staged a wild comeback in Tier 2/3 India – reporting 84% PAT CAGR in 5 years, 178% 1Y stock return, and a recent sales boom with ₹628 Cr revenue in Q1FY26. But with a P/E of 94 and zero dividend in sight, is this a fashionable frenzy or just another fast fashion flameout?


🧵 2. Introduction with Hook

Remember Vishal Megamart? The original “kirana plus fashion” behemoth that collapsed harder than a 2009 Satyam balance sheet?

Well, say hello to its resurrection story – V2 Retail Ltd, a phoenix from the retail ashes, now flexing store openings, normalized SSSG (same store sales growth) of 10%, and nearly ₹2,000 stock price – up 178% YoY.

Is this India’s answer to Ross Dress for Less, or are we all just buying into the hype of ₹199 kurtis and 40% EBITDA on discount days?


🛍️ 3. Business Model – WTF Do They Even Do?

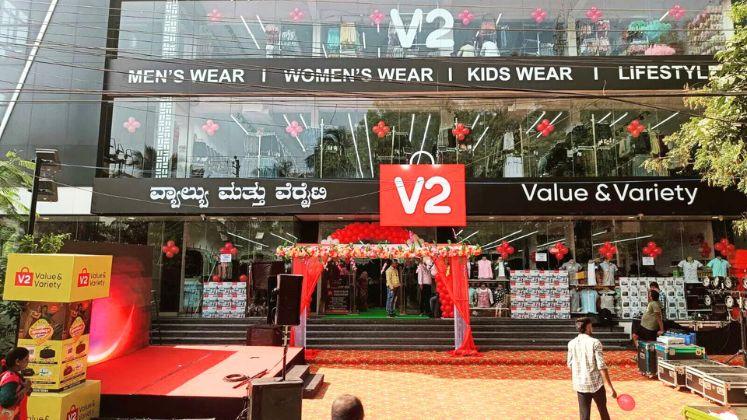
  • V2 Retail is a value apparel and general merchandise retailer, operating in Tier 2 and Tier 3 cities, targeting middle-income Indians.
  • Think: clothes, toys, cosmetics, home linen, and more – at budget-friendly prices.
  • Operates exclusive branded outlets (EBOs) under “V2 Retail” – 28 new stores opened in Q1FY26 alone.
  • Core pitch = affordable fashion for Bharat, aka ₹999 for 3 shirts combo while playing “Jhumka gira re…” on loop.

📊 4. Financials Overview – Profit, Margins, ROE, Growth

MetricFY21FY22FY23FY24FY25
Revenue (₹ Cr)5386298391,1651,884
PAT (₹ Cr)-13-12-132872
EBITDA Margin9%11%10%13%14%
ROE-3.76%-3.4%-3.73%8.04%20.82%
Sales Growth YoY-15%17%33%39%62%

💡 Profit growth = 84% CAGR over 5 years, which deserves an “Applause” button… until you see the P/E.


📉 5. Valuation – Is It Cheap, Meh, or Crack?

  • P/E = 94x 😵 (vs 52.5x median for sector)
  • P/B = 19.6x 😳 (vs 5x sector average)
  • Market Cap = ₹6,799 Cr
  • ROE (3Y Avg) = 10.5%

So basically:

  • Valuation = “Crack cocaine chic”
  • Fundamentals = Decent
  • Dividend = Non-existent (0% payout)

Fair Value Range?

Let’s be conservative and say:

  • Fair P/E = 40–45x on FY25 EPS of ₹20.82
  • → FV = ₹833 to ₹937
  • CMP = ₹1,964

⚠️ That’s a ~50% premium baked in already.


🍲 6. What’s Cooking – News, Triggers, Drama

  • 🔥 Q1FY26 Sales Jump: ₹628 Cr revenue, up 51% YoY
  • 🏬 28 new stores opened – store count expansion = growth steroid
  • 🧾 Same-store sales growth (SSSG) = 10% (normalized)
  • 🏦 Credit Rating Upgrade (IND A-/A2+)
  • 📈 FII/ DII increasing stake since FY24 – from 0.8% DII to 6.7% in Mar 2025
  • 🧹 Better inventory days (from 264 to 159), lower working capital cycles = leaner ops

🧾 7. Balance Sheet – How Much Debt, How Many Dreams?

YearBorrowings (₹ Cr)Reserves (₹ Cr)Networth (₹ Cr)
FY23₹424₹213₹247
FY24₹525₹240₹275
FY25₹850₹312₹347
  • Debt jumped from ₹424 Cr → ₹850 Cr in just 2 years 🧨
  • But reserve build-up is matching it somewhat
  • D/E ratio climbing → leverage is a risk if sales slow down

💵 8. Cash Flow – Sab Number Game Hai

  • FY25 CFO = ₹223 Cr (solid)
  • FCF = Negative due to high store capex and working capital
  • 🧯 Positive: Operating cash flows are healthy and consistently improving
  • ⚠️ Negative: Investments in fixed assets + store expansion are aggressive – no brakes

📐 9. Ratios – Sexy or Stressy?

RatioFY23FY24FY25
OPM %10%13%14%
ROCE %4%11%17%
Inventory Days184199159
CCC (Days)11410754
Working Capital Days888049
  • Very efficient operations now – CCC halved in 2 years
  • ROCE and OPM are finally in sync
  • Still no dividend tho 🥲

💸 10. P&L Breakdown – Show Me the Money

Let’s look at Mar 2025 Quarter:

  • Sales = ₹498 Cr
  • EBITDA = ₹57.8 Cr → OPM = 11.6%
  • Net Profit = ₹6.44 Cr → NPM = 1.3%
  • Interest = ₹21.4 Cr 😮 (eating into bottom line)

So basically, “We make money, then we pay rent and interest, then we think about profit” – a classic retail P&L.


🧵 11. Peer Comparison – Who Else in the Game?

CompanyP/EROCEOPMPAT 12MFV Range (EduEstimate)
V2 Retail94.416.6%13.7%₹72 Cr₹833–₹937
Trent134.530.7%16.5%₹1,436 Cr₹4,200–₹4,500
Go Fashion52.514.9%31.6%₹93.5 Cr₹750–₹850
Vedant Fashions50.426.6%46.3%₹388 Cr₹675–₹775

Verdict: V2’s margins and brand moat are lower than peers, but growth rate is among the best. Still… valuation is higher than it probably should be.


🧠 12. Miscellaneous – Shareholding, Promoters

  • 👑 Promoters hold 54.24% (no major pledging)
  • 🪙 FIIs trimmed stake from 6.6% → 1.3% (hmm…)
  • 🏦 DIIs ramped up from 0.4% → 6.7% (interesting switcheroo)
  • 🪢 35,000+ retail shareholders – classic SME cult stock story
  • 👔 MD: Ram Chandra Agarwal – same guy behind Vishal Megamart

🧑‍⚖️ 13. EduInvesting Verdict™

🧵 “Vishal se V2 tak ka safar” has been wild.

  • Profits are real
  • Sales are booming
  • Margins improving
  • Retail expansion is fast and furious

But…

  • P/E is sky-high
  • Debt is rising
  • FIIs exited quietly
  • No dividend still = zero cash reward

So what are you buying? A 178% rerated fashion chain… or a ₹2,000 kurta priced like Gucci?


✍️ Written by Prashant | 📅 10 July 2025

Tags: V2 Retail, Vishal Megamart, Smallcap Retail, Fashion Retail India, Tier 2 Growth, Store Expansion, EduInvesting, Retail Sector, SME Success Story

Leave a Comment

Popular News

error: Content is protected !!
Scroll to Top