🧠 At a Glance
Pokarna Ltd is India’s premium quartz and granite exporter riding the global demand for engineered stone. After a brutal FY23, FY25 has brought a dazzling turnaround—profits up 280%, margins at 38%, and FII/DIIs loading up. With high ROCE and a robust Quantra brand, is this India’s hidden export gem?
1. 🎬 Introduction: From Rock Bottom to Polished Comeback
What’s shiny, hard, and just posted a 280% YoY profit jump? No, not your ex’s karma — it’s Pokarna Ltd.
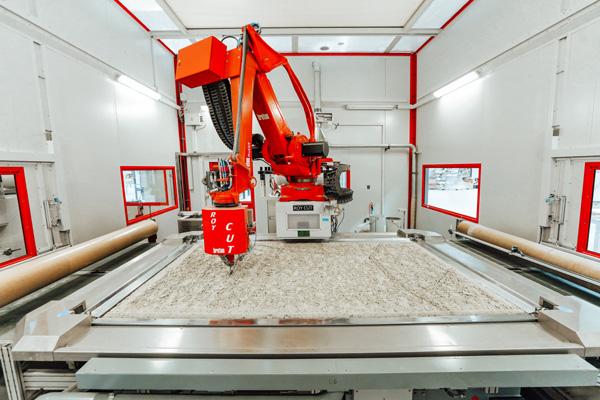
A decade-old underdog in the granite and quartz business, Pokarna has quietly become India’s engineered stone poster child. Its brand Quantra now serves 23 countries, with cutting-edge Bretonstone® tech and 100+ custom quartz designs.
And FY25? 🔥
- Revenue up 63% in Q4
- Profit up 280% YoY
- OPM touching 38% — Italian chef kiss levels
- ROCE at a spicy 29%
- Stock up 44% in 1 year
Let’s dig into what’s cooking under all that shiny stone.
2. 🏭 WTF Do They Even Do? (Business Model)
Pokarna = Two businesses:
- Quartz Surfaces (97% of revenue)
- Operated via subsidiary PESL (Pokarna Engineered Stone Ltd)
- Exports high-end quartz to the US, Europe, Middle East under Quantra brand
- Designs named “Moon Walk,” “Pirouette,” “Pantheon” – basically if your kitchen counter had an ego
- Granite (legacy biz)
- Minimal revenue now, mainly B2B export-grade granite slabs
They also dabbled in apparel (Stanza brand) but let’s be honest — who wears quartz?
3. 📊 Financials Overview: From Rocks to Riches
Revenue & Profit (Consolidated)
| FY | Revenue (₹ Cr) | Net Profit (₹ Cr) | OPM (%) |
|---|---|---|---|
| FY21 | 295 | 28 | 28% |
| FY22 | 650 | 78 | 27% |
| FY23 | 725 | 66 | 24% |
| FY24 | 687 | 87 | 31% |
| FY25 | 930 | 188 | 35% 🚀 |
- 5Y Sales CAGR: 19%
- 5Y PAT CAGR: 22%
- EPS FY25: ₹60.49
- ROE FY25: 27.4%
🧼 Clean recovery after COVID & tariff shocks.
4. 💸 Valuation – Is It Cheap, Meh, or Crack?
Key Valuation Metrics
- CMP: ₹1,033
- Market Cap: ₹3,204 Cr
- P/E: 17.1x (TTM EPS ₹60.5)
- Book Value: ₹251
- P/B: 4.1x
- Dividend Yield: 0.06%
Fair Value Range 💰
Let’s be conservative:
- EPS FY26E = ₹70
- Target P/E = 16x–20x
→ FV Range = ₹1,120 – ₹1,400
It’s not cheap, but for a company exporting 97% of its products and scaling margins past 35%, it’s not crazy either.
5. 🔥 What’s Cooking? (Triggers + Drama)
- 🔁 Quartz demand rebound in US despite tariff uncertainties
- 🧑💼 CEO of PESL resigned in June 2025 — market shrugged it off (wasn’t the founder)
- 🏗️ Capacity ramp-up led to record production
- 🇺🇸 Quantra’s US distribution channels improving – faster deliveries = faster billing
- 🏆 CRISIL reaffirmed strong ratings in July 2025 for both Pokarna & PESL
6. 🧾 Balance Sheet: Debt vs Dreams
| Metric | FY25 |
|---|---|
| Total Assets | ₹1,403 Cr |
| Borrowings | ₹330 Cr (↓ from ₹515 Cr in FY22) |
| Reserves | ₹772 Cr |
| Equity Capital | ₹6 Cr (unchanged for over a decade) |
✅ Debt reducing steadily
✅ Net Debt-to-Equity < 0.5x
✅ No equity dilution = shareholder-friendly
7. 💵 Cash Flow – Sab Number Game Hai
| FY | CFO | CFI | CFF | Net Change |
|---|---|---|---|---|
| FY23 | ₹136 Cr | -₹25 Cr | -₹114 Cr | -₹3 Cr |
| FY24 | ₹188 Cr | -₹32 Cr | -₹108 Cr | ₹47 Cr |
| FY25 | ₹191 Cr | -₹94 Cr | -₹101 Cr | -₹4 Cr |
Key Takeaways:
- Steady operating cash flows
- Capex continues (₹94 Cr in FY25)
- Financing outflows = debt repayment
8. 📈 Ratios – Sexy or Stressy?
| Metric | FY25 |
|---|---|
| ROE | 27.4% |
| ROCE | 28.8% |
| OPM | 35% |
| D/E | 0.4x |
| Inventory Days | 185 |
| Debtor Days | 73 |
| Cash Conversion Cycle | 153 Days |
Everything screams: lean, mean, export machine. Only red flag? 🟥 High working capital cycle.
9. 📊 P&L Breakdown – Show Me the Money
| Metric | FY25 |
|---|---|
| Revenue | ₹930 Cr |
| Operating Profit | ₹326 Cr |
| Net Profit | ₹188 Cr |
| EPS | ₹60.49 |
| Dividend | ₹0.75 (Token only 🪙) |
→ Highest ever margins at 35%
→ Big jump in volumes + better pricing in quartz
10. 🥊 Peer Comparison – Who Else in the Stone Game?
| Company | CMP (₹) | P/E | ROCE | OPM | Sales (₹ Cr) | PAT (₹ Cr) |
|---|---|---|---|---|---|---|
| Pokarna | 1,033 | 17.1 | 28.8% | 35% | 930 | 188 |
| Global Surfaces | 114 | — | -1.9% | -28% | 208 | -11 |
| Esprit Stones | 105 | 14.8 | 13.9% | 11.5% | 321 | 9 |
| Pacific Industries | 222 | 20.0 | 3.1% | 5.2% | 244 | 2 |
| Elegant Marbles | 242 | 21.9 | 3.6% | 15.8% | 28 | 0.4 |
✅ Pokarna has the best ROCE, margins, and scale
❌ Others struggling to even post consistent profits
11. 📚 Misc – Shareholding, Promoters, Stanza Saga
| Holder | Mar 2025 |
|---|---|
| Promoters | 56.66% |
| FIIs | 6.6% (↑ from 2.8% in FY23) |
| DIIs | 15.2% (↑ from 10.3%) |
| Public | 21.5% |
👀 Smart money increasing stake
🧵 Apparel (Stanza) = non-core and irrelevant now
🛠️ Capex mostly complete in quartz → margin expansion phase now
12. 🧑⚖️ EduInvesting Verdict™
Pokarna has emerged from the post-COVID rubble with shining margins, an FII stamp of approval, and the best numbers in India’s engineered stone space.
✅ Best-in-class margins
✅ Debt going down
✅ Global moat via Quantra
⚠️ Some key man exits + high working capital needs monitoring
FV Range = ₹1,120 – ₹1,400 (16x–20x FY26E EPS of ₹70)
Verdict: Quartz but not froth. Pricey, but polished.
✍️ Written by Prashant | 📅 July 9, 2025
Tags: Pokarna Ltd, Quantra, Quartz Export, Engineered Stone, India Export Stocks, Smallcap Multibagger, ROCE, FII DII Buying
