🧠 At a Glance
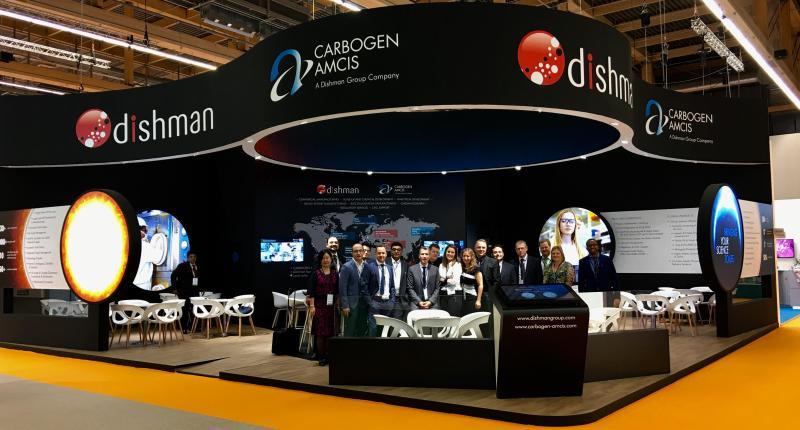
Dishman Carbogen Amcis Ltd is a global CRAMS (Contract Research and Manufacturing Services) player with fancy Swiss facilities, FDA clearances, and zero dividends. It has everything a pharma stock should—except consistent profits. After years of red ink and margin turbulence, FY25 brought a sliver of profit. Is this a turnaround or just another lab leak in your portfolio?
1. 🧨 Intro: From CRAMS to Crumbs
Once upon a time, Dishman was seen as India’s answer to Lonza. Fast-forward to 2025, and it’s basically the pharma version of a midlife crisis—fancy infrastructure, lots of international travel, but still asking parents (aka investors) for money.
After multiple global certifications, expansions in China and Switzerland, and years of capex, the numbers finally show a tiny ₹3 Cr profit.
🥲 “Itna toh intern bhi kama leta hai, bhai.”
2. 🧪 WTF Do They Even Do?
Dishman is in Contract Research & Manufacturing Services (CRAMS), a fancy way of saying “we’ll do the dirty lab work for big pharma.”
- 🧬 Segments:
- CRAMS for innovator pharma
- API manufacturing
- High-potency oncology drugs
- Specialty chemicals & vitamins
- 🌍 Locations:
- HQ in India
- Sites in Switzerland 🇨🇭, France 🇫🇷, UK 🇬🇧, China 🇨🇳
- 📦 Clients:
- Innovator MNCs who outsource drug development & manufacturing
- Recent push into ADC manufacturing — next-gen cancer treatments
Think of it as “scientific outsourcing” with Swiss branding. But so far, the real R&D has been in burning cash.
3. 💸 Financials – Profit, Margins, ROE, Hope
| Metric | FY23 | FY24 | FY25 |
|---|---|---|---|
| Revenue | ₹2,413 Cr | ₹2,616 Cr | ₹2,712 Cr |
| EBITDA | ₹332 Cr | ₹286 Cr | ₹469 Cr |
| EBITDA Margin | 14% | 11% | 17% |
| Net Profit | -₹30 Cr | -₹153 Cr | ₹3 Cr |
| ROCE | 1% | 0% | 2.44% |
| ROE | -1.9% | -9.8% | 0.2% |
- 📉 Sales CAGR (5Y): ~6%
- 📉 Net profit CAGR (3Y): Nahi hua bhai, negative hi tha
- 📈 TTM Net Profit is ₹3 Cr after 2 years of losses — baby steps
4. 📊 Valuation – Is It Cheap, Meh, or Crack?
| Metric | Value |
|---|---|
| CMP | ₹259 |
| Book Value | ₹372 |
| P/B Ratio | 0.70x ✅ |
| P/E Ratio | Not meaningful |
| Market Cap | ₹4,063 Cr |
| EV/EBITDA (TTM) | ~10.5x |
🧮 EduFV Range Calculation:
Assuming 17% EBITDA margin sustains, 12–15x EV/EBITDA is reasonable.
- EBITDA (sustainable) = ₹450–500 Cr
- EV = ₹5,400–₹7,500 Cr
- Net debt ~₹2,000 Cr ⇒ Implied MCap = ₹3,400–₹5,500 Cr
- 🔮 Fair Value Range = ₹220–₹350
👀 At ₹259, it’s somewhere in the middle. But this one’s a high-volatility bet with Swiss perfume.
5. 🍛 What’s Cooking – News, Triggers, Drama
- 🧪 US FDA Cleared:
- Bavla, Naroda, and Swiss facilities — ✔️ with zero 483s.
- 💀 Chairman Passed Away:
- Janmejay Vyas, a key promoter and founder — major succession moment.
- 🧑✈️ New CEO Appointed:
- Stephan Fritschi, Swiss pharma veteran. Needs to revive trust and EPS.
- 🇨🇳 China Facility Licensed:
- Shanghai unit gets greenlight for commercial ops.
- 💉 ADC Expansion:
- CHF 25M co-investment into high-margin antibody-drug conjugates.
Basically: all the right moves. But still a C+ report card.
6. 🧾 Balance Sheet – How Much Debt, How Many Dreams?
| Metric | FY25 |
|---|---|
| Net Worth | ₹5,800 Cr |
| Debt | ₹2,389 Cr |
| Fixed Assets | ₹7,270 Cr |
| CWIP | ₹255 Cr |
| Total Assets | ₹9,999 Cr |
- 💣 Heavy capex cycle — fixed assets + CWIP ~75% of total assets.
- 🧯 Debt up ₹500 Cr in 3 years. Still manageable… barely.
- 😵💫 High capital employed, but low returns = value trap risk.
7. 💵 Cash Flow – Sab Number Game Hai
| Year | CFO | CFI | FCF (approx) | CFF |
|---|---|---|---|---|
| FY23 | ₹266 Cr | -₹494 Cr | -₹228 Cr | ₹250 Cr |
| FY24 | ₹384 Cr | -₹230 Cr | ₹154 Cr | -₹22 Cr |
| FY25 | ₹375 Cr | -₹192 Cr | ₹183 Cr | -₹102 Cr |
✅ Operating cash stable
✅ Free cash flow turned positive
🚨 Still funding expansions through internal accruals + old debt
8. 📉 Ratios – Sexy or Stressy?
| Ratio | FY25 |
|---|---|
| ROCE | 2.44% |
| ROE | 0.21% |
| Debt/Equity | ~0.41x |
| Interest Coverage | ~1.5x |
| Inventory Days | 655 😵💫 |
| Cash Conversion Cycle | 577 😬 |
🧼 Working capital is a mess. Inventory bloated. Low margin + high inventory = margin killers.
9. 💰 P&L Breakdown – Show Me the Money
- 🔼 Revenue up 4% YoY
- 🔼 EBITDA nearly doubled in FY25 vs FY24
- ✅ Net profit (barely) turned positive
- ❌ High depreciation, high interest = value erosion
Basically: healthy top-line, barely breathing bottom-line.
10. 🧩 Peer Comparison – Who Else in the Game?
| Company | ROCE | OPM | P/E | MCap |
|---|---|---|---|---|
| Divi’s Lab | 20% | 31% | 84x | ₹1.8L Cr |
| Suven Pharma | 22% | 27% | 31x | ₹16,000 Cr |
| Syngene Intl | 14% | 25% | 53x | ₹28,000 Cr |
| Dishman Carbogen | 2.4% | 17% | N/A | ₹4,063 Cr |
🩻 Dishman’s valuation is dirt cheap, but that’s because its performance is dirt sad.
11. 📦 Misc – Shareholding, Promoters, FII Movement
| Category | Mar ’25 |
|---|---|
| Promoter | 59.32% |
| FII | 9.49% |
| DII | 1.26% |
| Public | 29.94% |
| Holders | 50,757 |
- 👀 FII holding has risen from 5.8% → 9.5% in 2 years
- 🚨 DII holding falling = cautious funds
- 😶 No pledging; promoter stake unchanged
12. 🧑⚖️ EduInvesting Verdict™
Dishman Carbogen is what happens when Swiss quality meets Indian execution speed. The biz model is great, facilities are FDA-cleared, and ADC capacity is a future growth driver. But after a decade of erratic profits and a dead ROCE, the market has trust issues — and rightfully so.
✅ Positives:
- Global CRAMS biz
- New management
- Clean audits + fresh facilities
❌ Risks:
- Chronic underperformance
- Capital-intensive + bloated WC
- Thin margin of safety if earnings don’t scale
🧮 Fair Value Range: ₹220 – ₹350
✍️ Written by Prashant | 📅 9 July 2025
Tags: Dishman Carbogen, CRAMS stocks, Swiss pharma, undervalued pharma, ADC capacity, turnaround stocks, pharma value picks, EduInvesting

