NSE: NPST | CMP: ₹2,049 | M-Cap: ₹3,973 Cr
🛸 India’s most explosive fintech nobody’s heard of outside LinkedIn. From ₹15 Cr in FY21 to ₹173 Cr in FY25 revenue – with 35% EBITDA margins and 112% profit CAGR – is NPST building India’s next Paytm… or just riding UPI’s coattails?
1. 📌 At a Glance
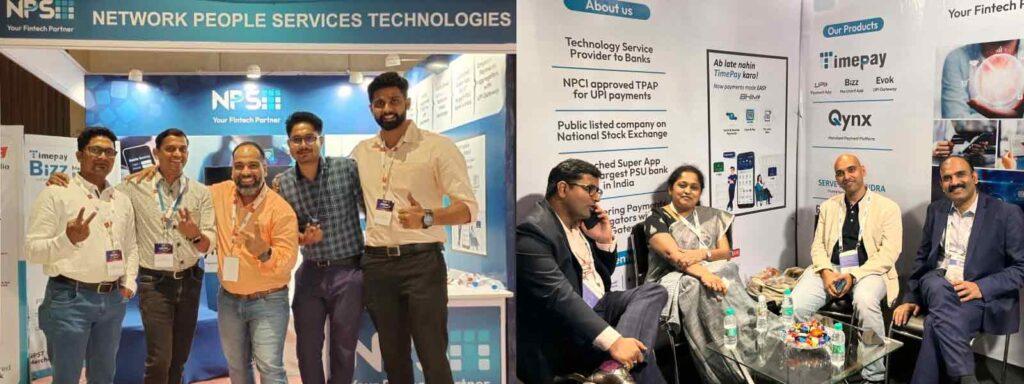
Incorporated in 2013, Network People Services Technologies Ltd (NPST) is a fintech infra player that helps banks go digital – building UPI stacks, RegTech dashboards, payment gateways, and more. It’s a TSP (Third Party Provider) and also operates in PPaaS (Payment Platform as a Service), the B2B cousin of the flashy fintech apps you see in IPL ads.
2. 🧨 Introduction with Hook
“UPI toh sab use karte hain, but kisi ne poocha – who’s building it for the banks?”
NPST is that nerdy coder behind the scenes, silently making ₹173 Cr in FY25, with a 35% OPM and an ROE of 55.7%. From signing African contracts to clocking 312% stock return in 3 years, this micro-cap has quietly become one of India’s most profitable tech dwarfs.
But wait – P/E of 88, CMP/BV of 38.3, and no dividends? Is this just another “growth-at-any-bloody-price” trade?
3. 💼 WTF Do They Even Do? (Business Model)
NPST is basically the invisible fintech plumber. Here’s what they offer:
- 🔗 UPI Stack Enablement: Enables banks to offer UPI via their app – without building infra in-house. (Example: Your co-op bank’s UPI is likely NPST-powered.)
- 🏦 BBPS, AEPS, IMPS: Payment solutions for rural banks and small finance banks.
- 🧠 RegTech Products: Real-time fraud monitoring, reporting, and compliance dashboards.
- 🔌 PPaaS (Platform as a Service): White-labeled solutions for fintechs, NBFCs, co-op banks.
- 🌍 International Expansion: Signed deal in May 2025 to set up digital payment infra for a regulated African financial institute.
Essentially: Low-key SaaS + infra + compliance toolkit for UPI-era banking.
4. 💰 Financials Overview: Profit, Margins, ROE, Growth
| Metric | FY21 | FY22 | FY23 | FY24 | FY25 |
|---|---|---|---|---|---|
| Sales (₹ Cr) | 15 | 19 | 41 | 128 | 173 |
| Net Profit (₹ Cr) | 1 | 2 | 7 | 27 | 45 |
| Operating Margin (%) | 19% | 18% | 30% | 33% | 35% |
| ROCE (%) | 23% | 14% | 35% | 83% | 72% |
| ROE (%) | 0.8% | 0.77% | 3.4% | 13.8% | 23.2% |
✅ 5-year Profit CAGR: 112%
✅ ROCE > 70%
🚨 But… Debtor Days shot up to 67 from 3 in FY24 – red flag for collections.
5. 📉 Valuation – Is It Cheap, Meh, or Crack?
| Metric | Value |
|---|---|
| P/E (TTM) | 88.5x |
| CMP / Book Val | 38.3x |
| Market Cap | ₹3,973 Cr |
| TTM PAT | ₹45 Cr |
| EV / Sales | ~22x |
At 88x earnings and 38x book, NPST is priced like a SaaS unicorn, but it’s still earning like a SME infra vendor. There’s zero dividend, thin float, and FII+DII ownership is <1%.
🧮 Fair Value Range (EduInvesting Estimate)
Based on 50x FY26E EPS (~₹38) = ₹1,900–2,200
(Assumes 35% PAT CAGR but discounts high debtor risk)
6. 🍲 What’s Cooking – News, Triggers, Drama
- 🪙 Africa Deal Signed (May 2025): NPST to build digital infra for a regulated African F.I. Could open doors to cross-border SaaS revenues.
- 📈 Revenue up 4x in 2 years: ₹41 Cr (FY23) → ₹173 Cr (FY25)
- 🧾 Zero Debt, Zero Dividend: They’re keeping all profits in-house.
- 👀 High Insider Holding: Promoters hold 67.5%, almost unchanged.
- 📢 UPI for Credit Cards Coming: Big boost if NPST can enable CC issuers.
- 📉 40% Q-o-Q drop in Mar 2025 PAT: Needs watching.
7. 🏦 Balance Sheet – How Much Debt, How Many Dreams?
| Year | Borrowings (₹ Cr) | Equity (₹ Cr) | Reserves (₹ Cr) | Debt/Equity |
|---|---|---|---|---|
| 2021 | 0 | 4 | 2 | 0 |
| 2023 | 0 | 6 | 22 | 0 |
| 2025 | 5 | 19 | 84 | 0.06 |
📌 Tiny debt (₹5 Cr), healthy reserves (₹84 Cr). Their dream is funded.
8. 💵 Cash Flow – Sab Number Game Hai
| Year | CFO (₹ Cr) | CFI (₹ Cr) | CFF (₹ Cr) | Net Cash Flow (₹ Cr) |
|---|---|---|---|---|
| 2021 | 2 | -3 | 0 | -1 |
| 2023 | 24 | -6 | 0 | 18 |
| 2025 | 29 | 8 | 7 | 44 |
💡 No cash flow frauds detected. Steady improvement in operating cash flow.
9. 📊 Ratios – Sexy or Stressy?
| Metric | FY25 |
|---|---|
| ROCE | 72% |
| ROE | 55.7% |
| Debtor Days | 67 |
| Cash Conversion | -38 days (excellent) |
| OPM | 35% |
🚨 Warning: Rising debtor days could hit cash flow in future quarters.
10. 🧾 P&L Breakdown – Show Me the Money
- Revenue: ₹173 Cr (FY25)
- Gross Margin: Stable at ~65%
- EBITDA: ₹60 Cr (EBITDA Margin 35%)
- Net Profit: ₹45 Cr (26% PAT margin)
- EPS (TTM): ₹23.16
From selling infra to co-op banks to hitting ₹45 Cr profit – this SME has scaled quietly, profitably.
11. 🤼 Peer Comparison – Who Else in the Game?
| Company | CMP (₹) | P/E | ROCE (%) | Sales (₹ Cr) | PAT Margin |
|---|---|---|---|---|---|
| NPST | 2,049 | 88.5 | 72.2 | 173 | 26% |
| Netweb Tech | 1,823 | 90.3 | 32.6 | 1,149 | 10% |
| Tata Tech | 708 | 42.4 | 25.8 | 5,168 | 13% |
| Affle | 2,012 | 74.1 | 16.8 | 2,266 | 17% |
✅ NPST wins on ROCE, margins, and growth
🚨 But smallest by revenue, highest P/BV
12. 📚 Miscellaneous – Shareholding, Promoters, Other Shenanigans
- 🧑💼 Promoter Holding: 67.55% (stable)
- 🌍 FII Holding: 0.03%
- 🧑🤝🧑 Public Holding: 32.12%
- 📈 No major dilution, but equity grew from ₹6 Cr to ₹19 Cr post-listing
No pledging, no buybacks, no dividend. Just vibes and charts.
13. 🧑⚖️ EduInvesting Verdict™
“If UPI infra had a backend superhero, it would be NPST – invisible, underpaid, and insanely efficient.”
📉 Yes, the stock trades at 88x earnings.
📈 But it’s also delivering 112% PAT CAGR, 70%+ ROCE, and global contracts.
🧮 Fair Value Range (FY26): ₹1,900 – ₹2,200
(Assumes 50x normalized EPS and steady profit growth)
❌ No buy-sell reco. Just clean facts and fintech drama.
✍️ Written by Prashant | 📅 July 6, 2025
Tags: NPST, UPI Stocks, Fintech India, Small Cap IT, African Deal, EduInvesting, Growth Stocks, 13-Point Article


