Shankar Lal Rampal Dye-Chem: ₹465 Cr Revenue, 14% ROCE, but Margins Keep Dodging Left
Spotted a factual error — a wrong number, date, or fact? Tell us and we will check the source.
General information and entertainment, not investment advice. The author is not a SEBI-registered adviser or research analyst. No recommendation, no promised returns. Markets carry risk including loss of capital. Figures may not be current. Consult a registered adviser before acting.
Prices referenced are not live. CMP is ₹39.3 as of 17 June 2026. Latest results are for the year ended 31 March 2026.
1. At a Glance
Revenue hit ₹465 Cr in FY26, up 61% year-over-year from ₹288 Cr in FY25—a sharp acceleration from the glacial 16% TTM growth the company had been managing. Profit jumped 106%, from ₹6.5 Cr to ₹13.5 Cr, which sounds heroic until you notice it came from a low base: FY25 was a stumble, with earnings down 59% YoY.
Operating margin rebounded to 4.1% (Q4 FY26) from 3.4% (FY25 full year), still shy of the 4.2% five-year median the company itself has achieved. EPS leaped to ₹2.11 for FY26 from ₹1.02 in FY25. The market pays 18.6× earnings, nearly half the peer band of 33.8×—a valuation gap that screams either “cheap” or “the peers are pricing something SLRDCL is not.”
Debt ticked up ₹19 Cr in FY26 to ₹25.4 Cr; net cash position stays thin at ₹0.1 Cr, giving the balance sheet zero cushion for surprises.
Reader question: If a 61% revenue bump and margin recovery only lift the stock P/E to half the peer median, is the market skeptical of durability, or did the peers simply overshoot?
2. Introduction
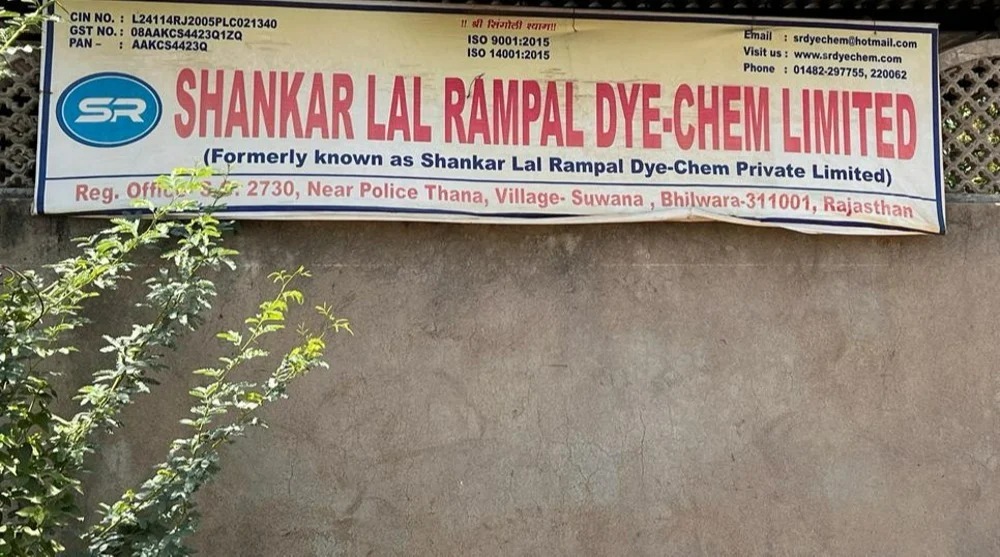
Shankar Lal Rampal Dye-Chem (SLRDCL) is a Bhilwara-based trader, exporter, and supplier of dyes and chemicals—a narrow moat, commoditized space where pricing power is a wish and volume is god. Incorporated in 2005, the company operates as an intermediary, sourcing chemical products (paraffin wax, phosphoric acid, citric acid, hydrogen peroxide, sodium compounds) and reselling them to textile mills, garments makers, and chemical processors across India and 15+ export markets.
The family—Inani and Rampal clans—hold 73.6% of the stock, mostly through direct names. No institutional players. Promotional shareholding has flatlined for two years. The public float hovers at 26.4%.
FY26 was a recovery play: after FY25’s operating profit plunged 61% to ₹9 Cr, the company clawed back to ₹19 Cr in FY26. Revenue momentum picked up materially in Q4, posting ₹139 Cr (30% YoY growth) compared to Q3’s ₹122 Cr. The board approved an acquisition for backward integration and manufacturing expansion in July 2025—a signal the trading desk thinks there’s more margin to wring by controlling the supply chain.
3. Business Model: WTF Do They Even Do?
SLRDCL buys dyes and chemicals from upstream makers and redistributes them to end-use sectors: textiles (70%+), garments, dyes manufacturers, and niche chemical converters. The company holds agency arrangements in India and abroad, earning slim commissions and spreads—typically 2–4% EBITDA margins in commodity trading.
Revenue breakdown from FY23 filings shows dyes and chemicals account for ~99% of sales; commission income is noise at 1%. Geographic split: 95% domestic (mostly the textile belt in western and southern India), 5% exports.
The product mix is wide but shallow. There’s zero differentiation. A customer comparing SLRDCL’s phosphoric acid shipment against three competitors bases the decision on price, delivery speed, and credit terms—in that order. The company is a logistics appendix to the chemical supply chain, not a technology or brand story.
Working capital consumption is the real pain point. Debtor days averaged 77 over FY23–26, inventory days sit at 12, and payables drag at a paltry 5 days—leaving a cash conversion cycle of 84 days. Every ₹100 Cr of revenue locks ₹23 Cr in receivables and inventory for three months. Growth strains the balance sheet relentlessly.
The family’s attempt to acquire a manufacturing asset signals awareness of this trap: if SLRDCL can move backward into dye production or chemical synthesis, margin can shift from 3–4% to 8–10%, and working capital intensity drops. Until then, this is a volume play in a price-taking, capital-starved business.
4. Financials Overview
Figures are consolidated, in ₹ crore, quarterly results.
Metric
Q4 FY26
Q4 FY25
YoY
QoQ (Q3)
Revenue
139.30
106.75
+30.5%
+13.9%
EBITDA
6.80
3.80
+78.9%
+9.9%
PAT
4.80
2.52
+90.5%
+13.2%
EPS (₹)
0.75
0.39
+92.3%
+15.4%
OPM
4.9%
3.6%
—
—
Annualized FY26 (full year):
Metric
FY26
FY25
YoY
Revenue
465
288
+61.5%
Net Profit
13.5
6.5
+107.7%
EPS (FY26 reported)
2.11
1.02
+106.9%
Q4 was the best-performing quarter of FY26. Revenue spiked on strong textile demand in March (month-end push-outs, inventory builds ahead of summer selling season). Operating profit doubled YoY. PAT benefited from lower tax rate (26.2% vs. 28.6% in FY25) and interest costs down to ₹0.23 Cr.
Over FY25 and FY26, the company’s trajectory inverted. FY25 was a mess: operating profit cratered 61% to ₹9 Cr despite only a 12% revenue decline, signaling margin compression from either raw material spikes, excess inventory writedowns, or customer mix shift. FY26 recovered both legs—revenue and margin—though OPM remained 50 bps shy of the five-year run rate.
5. Market Expectations & Historical Multiples
This section describes how the market is currently pricing the company and how that compares with its own history and peer group. It is descriptive, not predictive.
Metric
Current
FY23–FY25 Avg
Peer Median
P/E
18.6×
38.2×
33.8×
EV/EBITDA
14.2×
—
—
ROE
11.6%
10%
—
ROCE
14.0%
12.5%
14.1%
The market currently pays 18.6× earnings here, versus a peer median of 33.8×. SLRDCL trades at a 45% discount to its chemical-sector comparison set—a gap large enough to smell opportunity or signal structural doubt.
Historically, SLRDCL earned 38.2× earnings on average over FY23–25, meaning the stock has compressed from nosebleed valuations (FY22–23 saw it trade at 55–140×) down to single-digit-multiple territory now. That rerating reflects the FY25 stumble and lingering skepticism about margin durability.
ROCE at 14% sits in line with the peer median of 14.1%, suggesting the company is not destroying capital. ROE of 11.6% is middling for a small-cap with a large promoter base and no leverage constraints. The equity base is ₹127.9 Cr (including reserves) as of FY26; profits of ₹13.5 Cr generate