Insecticides India FY26: Premium Portfolio Powers 7% Growth, But Margins Need Proof
General information and entertainment, not investment advice. The author is not a SEBI-registered adviser or research analyst. No recommendation, no promised returns. Markets carry risk including loss of capital. Figures may not be current. Consult a registered adviser before acting.
1. At a Glance
Revenue climbed 7% to ₹2,140 crore in FY26, yet net profit inched down 1.7% to ₹139.41 crore. The company ended the year with ₹157 crore in debt against ₹1,220 crore of net worth—low leverage, but the cash pile is now locked in ₹780 crore of inventory, a full 36% of sales.
Premium products (Maharatna and Focused Maharatna) now account for 60–63% of sales, a climb from 55% three years ago. The B2C channel contributes 73% of revenue; B2B sits at 22%. The market pays 15.1x earnings, a discount to peers who trade at a median 23.65x.
Distributor network spans 8,500 dealers and 7,500+ customer touchpoints. New product sales are rising (₹322 crore from patented products, ₹324 crore from combos), yet channel logistics remain strained—the company acknowledged “heavy goods returns” in dry-crop herbicides last year from mid-season weather swings.
Schlesinger moment: Can a company whose operating margin fell from 11% (FY22) to 6% (FY23) now prove it can defend double-digit margins amid pricing discipline and premiumization, or will it spend the next two years explaining inventory?
2. Introduction
Insecticides India was founded in 1996, went public in 2007, and spent the last five years building a dual personality. Hari Chand Aggarwal and Rajesh Kumar Aggarwal (now with son Sanskar recently appointed to the Board in May 2026) control 72.3% of equity. The company manufactures agrochemical formulations, technical actives, and biologicals across four states: Rajasthan, Jammu & Kashmir, and Gujarat.
FY26 was a year of restocking narrative collision. Supply chains tightened globally (crude-linked raw materials spiked ~10%), pushing the market toward a “supplier-driven environment,” per management on the June 2026 earnings call. Demand in May 2026 was “sluggish”—farmers and distributors waited for monsoon onset. By June, the call notes say, channel activity was expected to improve.
The company’s own moves tell a story of caution: two price increases in April (first “very much appreciated,” the second faced resistance; discounts had to follow). A third action in June was deferred, conditional on demand pickup. Management refused hard margin guidance—”It is difficult to comment”—yet acknowledged consensus expects margins to be “positive and potentially improve.”
One executive shift: Sanjay Vats, VP of Sales & Marketing, resigned in May 2026. This moves down the chain to operational continuity questions.
3. Business Model: WTF Do They Even Do?
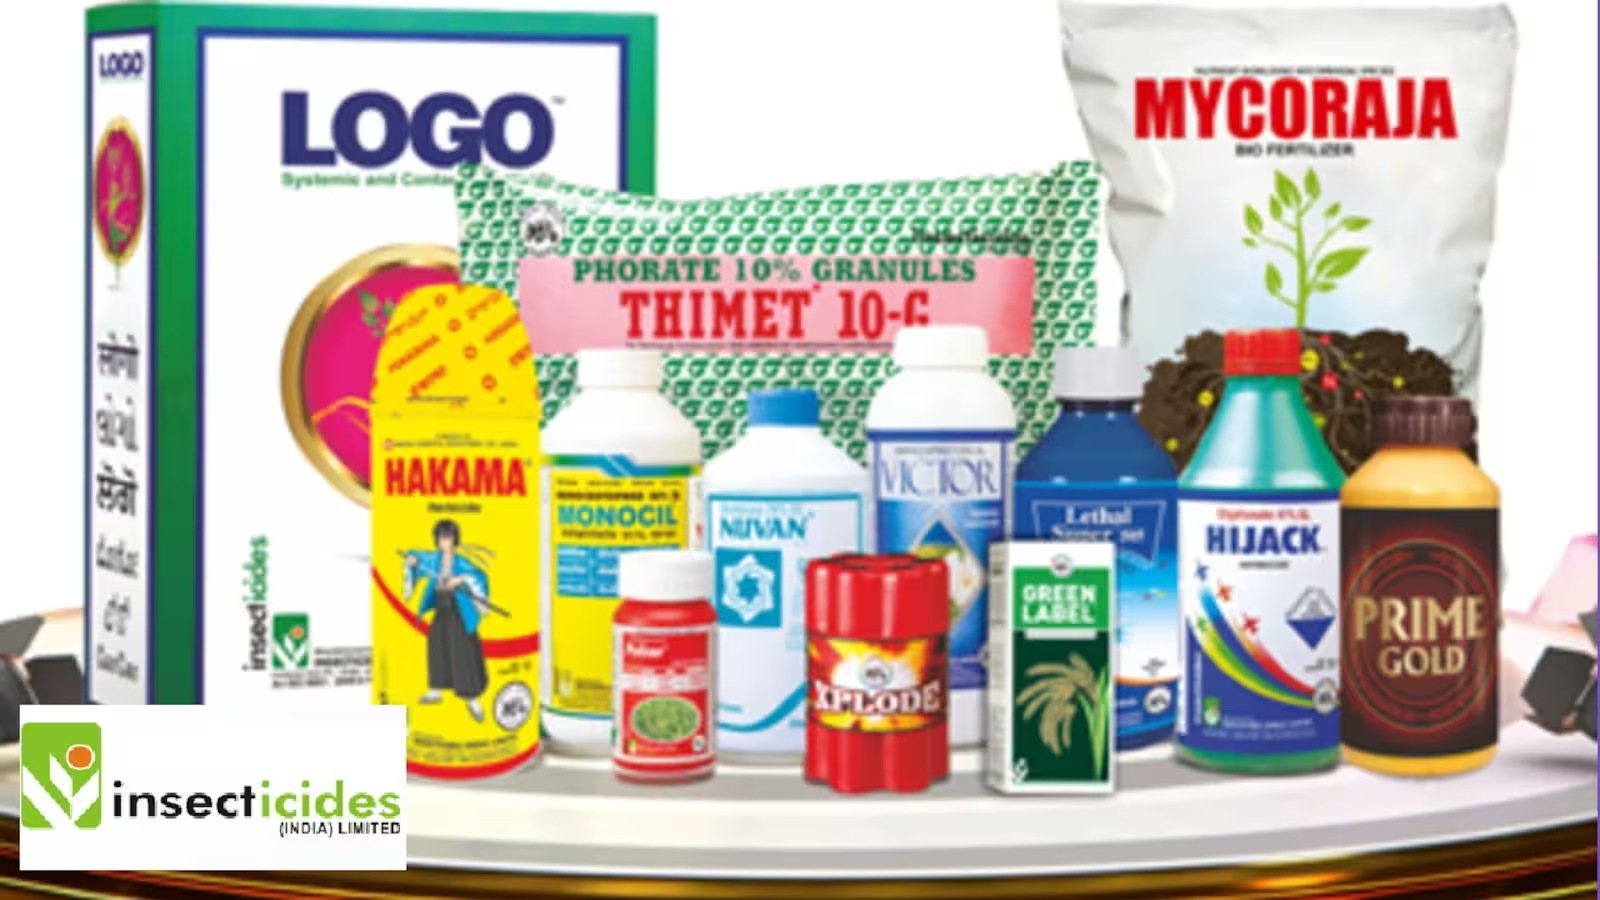
Insecticides India manufactures 140+ formulation products and 20+ technical (active ingredient) products across three categories: insecticides, herbicides, fungicides, plus biologicals and plant growth regulators.
The portfolio splits as follows: insecticides (48% of H1 FY25 sales, down from 53% in FY22); herbicides (39%, up from 33%); fungicides (10%, stable); biologicals (3%, new). Under the hood live flagship brands—Tractor, Green Label, Pulsor, Hakama, and the premium Maharatna series (Hercules, Lethal, Hachiman, Shinwa). The company has 75+ product registrations in India and exports to 22 countries.
Distribution: 28 depots, 8,500 dealers, 70,000 retailers, 1,000+ crop advisors (peaks to 1,400 seasonally), and 75 lakh farmer connection claims (data as of May 2026). One subsidiary, Kaeros Agrisolutions (acquired for <₹6 crore), was launched to run parallel distribution and offer white-label P2P business. FY26 Kaeros PAT was ₹5+ crore; FY27 target is to double sales.
Manufacturing footprint: Sotanala (formulations), Chopanki (technicals), Samba/Udhampur (J&K), Dahej (Gujarat, new facility ramping). Total installed capacity: 80,750 MTPA granules, 30,900 KLPA liquid, 15,800 MTPA active ingredients. Sahaj estimates ~95% of revenue is in-house manufactured.
R&D: four centers, 24 granted patents, 21 pending. Partnerships with Nissan Chemical (Japan) and Corteva (US) yield joint product launches (Altair, SPARCLE, Granuvia announced; SPINOACE and Green Mix in pipeline). In-licensing contribution: ₹226 crore in FY26.
New product velocity: 5 products launched in FY26, contributing ₹40 crore. Prior-year launches grew from ₹23 crore to ₹82 crore—a sign that the engine does turn, but the number is still <4% of sales.
Revenue rose 7.0% to ₹2,140 crore. Operating profit held nearly flat at ₹227 crore (EBITDA ₹262.50 crore). Net profit slipped to ₹139.41 crore, down from ₹142 crore in FY25—driven by a ₹9 crore increase in deferred tax provisioning, per management. On a trailing-twelve-month (TTM) basis, profit growth sits at −1.72%, a mild pivot from year-on-year expansion.
Q4 (Mar 2026) showed “approximately 19% growth” in revenue; premium products delivered “about 24% growth.” The quarter contributed ₹426 crore in sales and ₹11.71 crore in net profit—a net margin of 2.75% for that quarter alone, highlighting quarterly volatility.
Management framed FY26 as “operating under supply side constraints across several key raw materials,” with input inflation pushing realisations lower and requiring deliberate pricing action to recover. The mix, however, shifted upward: B2C now 73% of revenue (vs. 65% three years ago); premium products now 60–63% vs. 55% in FY22.
Concall Color: Management expects FY27 revenue growth of 8–10% and “margin to be positive and potentially improve” but “difficult to comment” on exact numbers. The monsoon tilt will be a key driver; dry-crop herbicides saw material returns last year when mid-season dryness hit.
5. Market Expectations & Historical Multiples
This section describes how the market is currently pricing the company and how that compares with its own