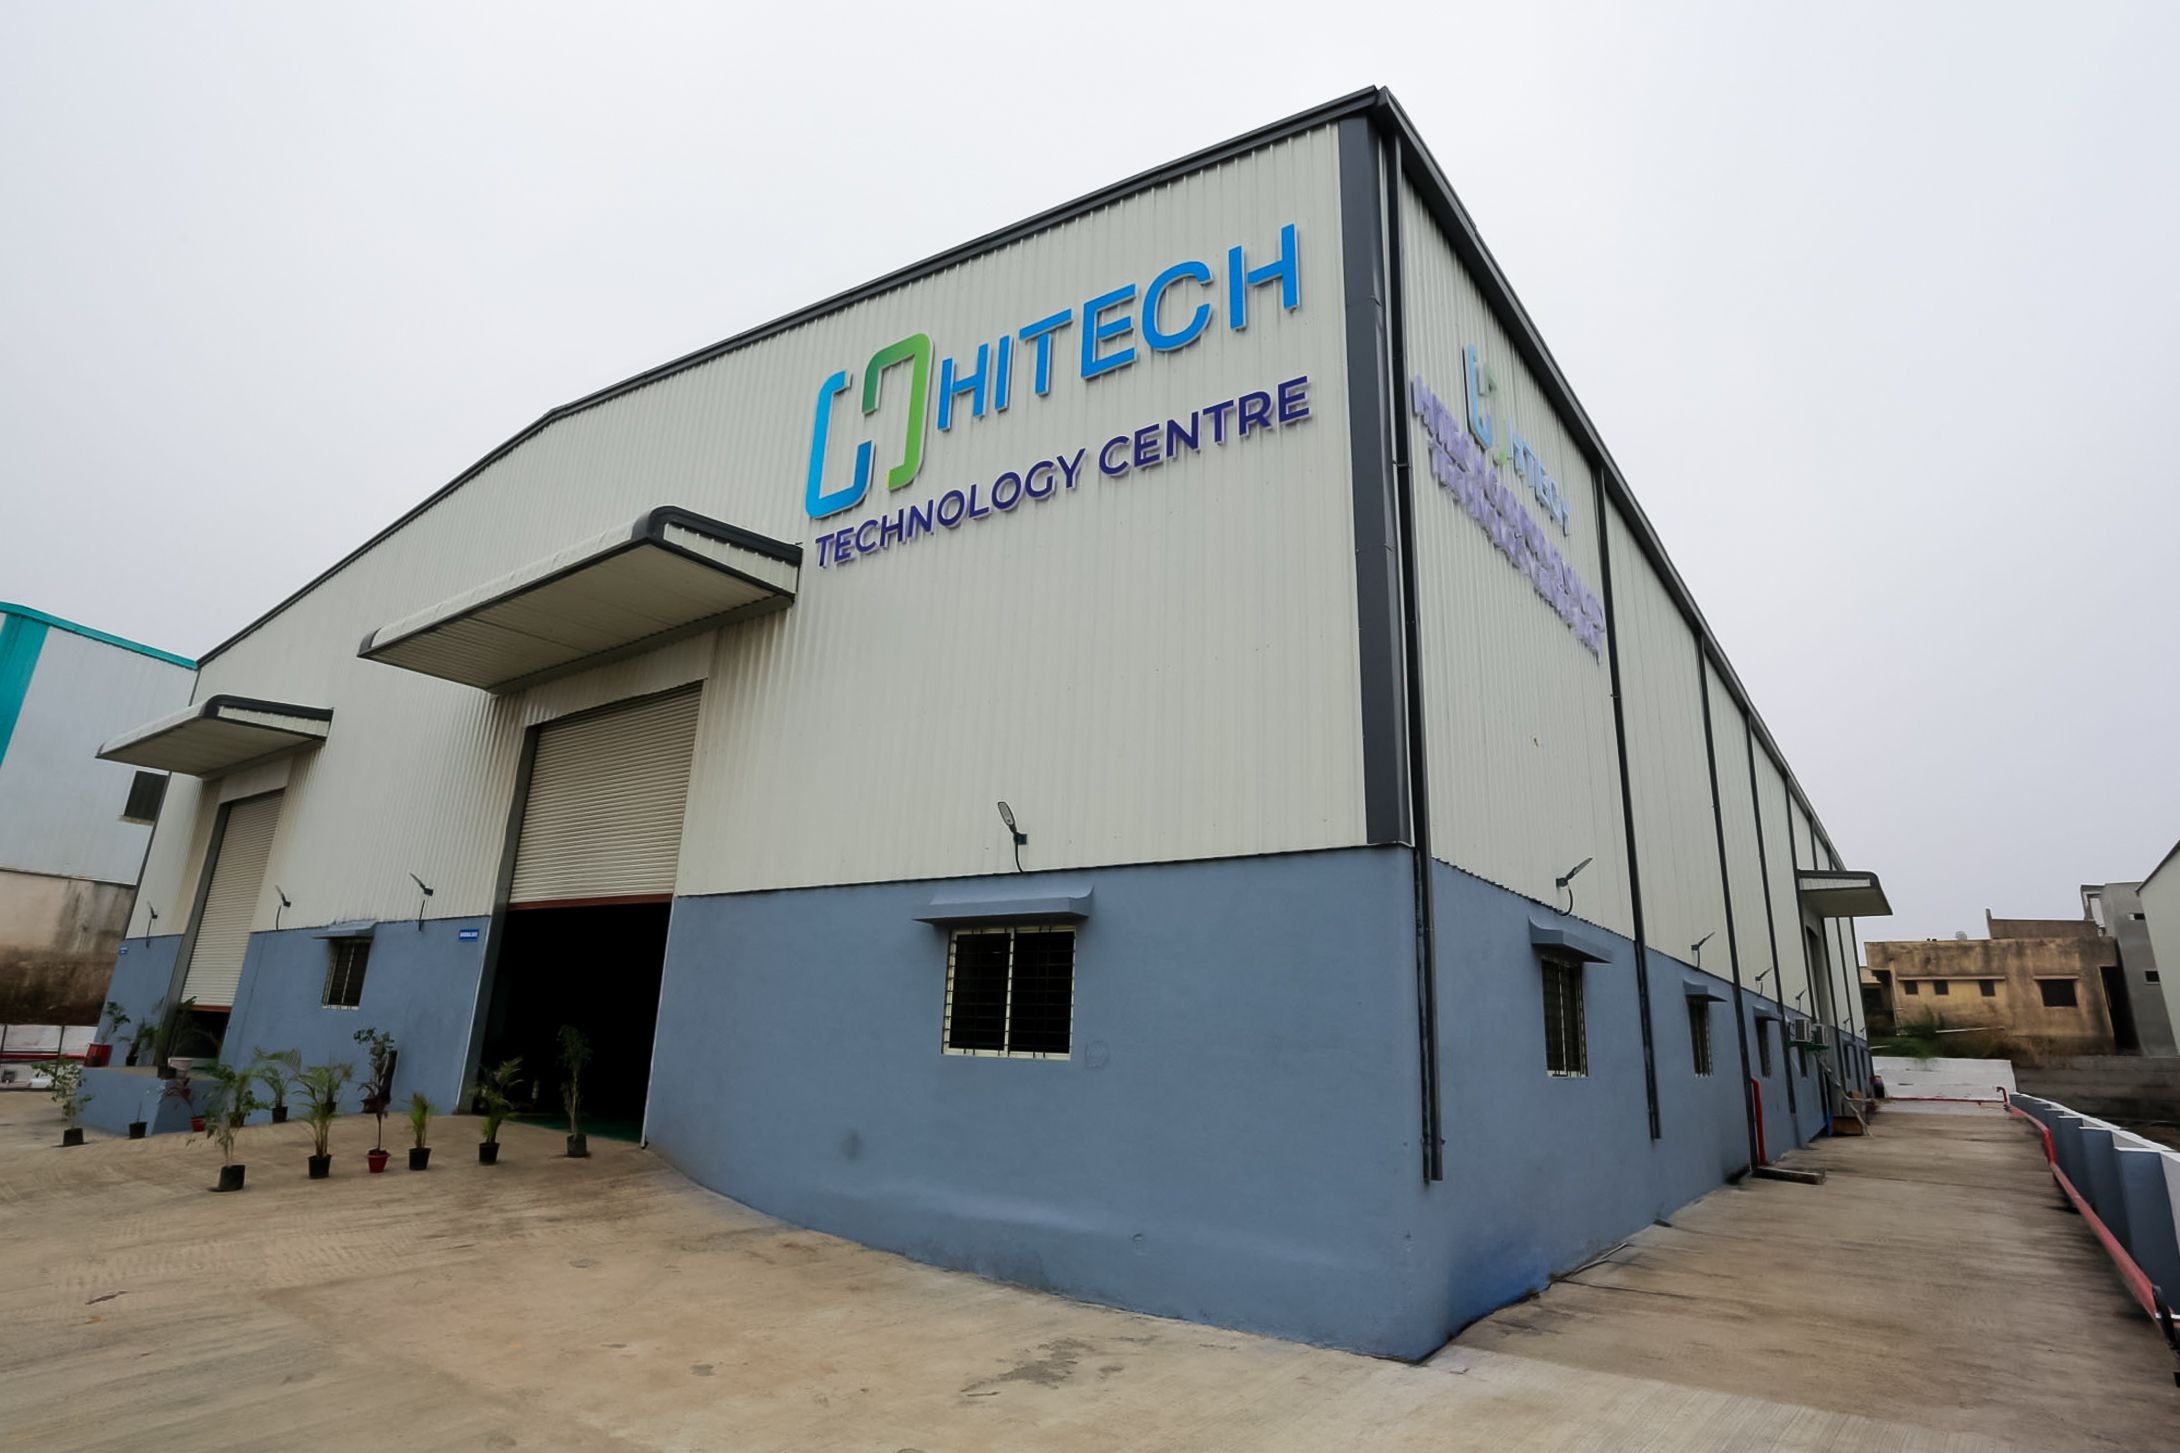
Hitech Corp. Mar 2026: Delisting Drama Explodes Amid a 326% Quarterly Profit Surge
Section 1 — At a Glance
The investment landscape for plastic packaging specialists changed fundamentally overnight. Hitech Corporation Ltd capped off its financial year with a massive headline acceleration, reporting a 326% year-on-year surge in quarterly net profit to ₹8.89 crore for March 2026, up from ₹2.09 crore in the corresponding prior period. This operational sprint pushed full-year revenue to ₹640.40 crore, a 14.1% annual expansion that reflects robust volumes across its manufacturing footprint.
However, public market participants may have little time left to act on these numbers. Simultaneously with its earnings release, the promoter group initiated a voluntary delisting proposal to acquire all outstanding public shares at an indicative price of ₹353 per share. This dramatic move highlights a classic microcap paradox where structural transformations are pulled private just as long-term capital investments begin to bear fruit.
While the bottom-line acceleration creates an impressive near-term optical signal, significant balance sheet constraints remain embedded in the business. Total borrowings escalated to ₹132.00 crore by the close of the period, which continues to limit structural return profiles despite strong underlying client demand from dominant players in the industrial coatings sector. True corporate performance is rarely captured by an isolated quarterly acceleration when capital reallocation decisions are being managed exclusively for long-term strategic positioning. The unfolding delisting sequence now sets up a high-stakes standoff between minority shareholders and the controlling promoter group regarding the firm’s terminal valuation.
Section 2 — Introduction
Hitech Corporation Ltd, established in 1991, operates as a specialized mid-tier manufacturer within the rigid plastic packaging ecosystem. The company has spent decades cultivating a highly defensive niche by anchoring its operational volume to the industrial supply chains of structural giants across India. Operating away from the flashier consumer tech or specialty chemical headlines, Hitech focuses entirely on industrial-grade injection moulding, blow moulding, and extrusion processes across its multi-location manufacturing base.
The company’s recent strategic trajectory features a distinct pivot toward consolidating its domestic positioning while testing international frontiers, underscored by the recent incorporation of its wholly-owned subsidiary, Hitech Global Inc, in the United States. Yet, even as it looks westward, the absolute core of Hitech’s economic engine remains deeply tied to a powerful domestic parentage and ecosystem. As an enterprise linked intimately to the legacy of major domestic industrial houses, it functions effectively as an outsourced manufacturing arm disguised as a standalone small-cap packager.
Section 3 — Business Model: WTF Do They Even Do?
Hitech Corp’s business model is conceptually straightforward: they take polymer resins, melt them down, and shape them into containers that hold things you shouldn’t drink—paints, agrochemicals, engine lubricants, and industrial coatings. If you have bought a bucket of premium wall paint or a jug of motor oil in India over the last thirty years, you have almost certainly handled Hitech’s primary output without realizing it.
The absolute center of gravity for this business model is its extreme customer concentration. A single giant, Asian Paints Ltd, routinely consumes over 60% of Hitech’s total manufacturing capacity. To formalize this co-dependent relationship, the company recently locked in a massive related-party transaction framework approving sales of up to ₹800 crore per year to Asian Paints through 2027.
Hitech maintains 12 distinct manufacturing facilities scattered across industrial corridors in India to ensure they are close to their clients’ blending plants. It is an efficient, high-volume, low-margin game where success depends on keeping the extrusion machines running 24/7 and praying that raw material plastic resin prices do not spike unexpectedly.
Section 4 — Financials Overview
Figures are consolidated, in ₹ crore.
Quarterly Performance Trend
Metric
Latest Quarter (Mar 2026)
YoY Change (%)
QoQ Change (%)
Revenue
166.00
11.19%
14.39%
EBITDA / Operating Profit
21.36
35.45%
67.01%
PAT
8.89
325.51%
Turnaround
Reported EPS (₹)
5.18
324.59%
Turnaround
The financial year closed with an absolute firework of a final quarter. Revenue grew a solid 11.19% year-on-year to hit ₹166.00 crore, but the real story is lower down the page