International Conveyors Mar 2026: The ₹59 Crore Other Income Smoke Screen
At a Glance
A multi-year narrative of explosive bottom-line performance requires absolute structural integrity under microscopic examination. International Conveyors Ltd presents an astonishing trajectory, with net profit scaling from ₹62.39 crore in FY24 to a towering ₹68.38 crore in FY26. However, a fundamental divergence between structural operational profitability and headline net profit signals deep earnings-quality friction. While headline metrics suggest robust enterprise acceleration, an examination of core operational revenue against non-operating inflows alters the analytical thesis.
The primary investment thesis centers on the sustainability of core manufacturing activities. Revenue from operations rebounded strongly to ₹213.13 crore in FY26 after a sharp contraction to ₹133.93 crore in FY24, pointing to an apparent revival in industrial demand. Yet, the operating machinery appears increasingly secondary to a massive treasury and equity deployment matrix. Out of a total Profit Before Tax of ₹88.99 crore in FY26, a staggering ₹58.77 crore was derived from Other Income.
The critical worry signal lies within operational cost scaling and working capital velocity. Raw material consumption surged to ₹124.74 crore in FY26, severely squeezing manufacturing gross spreads, while general other expenses bloated to an unprecedented ₹42.75 crore. Compounding this pressure is a severe escalation in working capital days, which expanded to 646 days. High reported returns frequently mask localized balance sheet friction when capital allocation shifts from industrial expansion to speculative treasury management. This structural transition forms the core backdrop of the current financial year.
Introduction
Incorporated in 1973, International Conveyors Ltd (ICL) has spent over five decades carving out its existence in the industrial landscape. Established initially by Rajendra Kumar Dabriwala to address critical domestic logistics shortages in the coal mining ecosystem, the company pivoted over the years to reduce its reliance on a single territory.
Today, it operates as a specialized manufacturer, managing an industrial footprint through its production facilities in Aurangabad and a dedicated export facility in the Falta SEZ near Kolkata. While the company maintains an active presence across domestic supply infrastructure, its business model has increasingly integrated with global resource supply chains, routing specialized products directly to heavy industrial operations globally.
Business Model: WTF Do They Even Do?
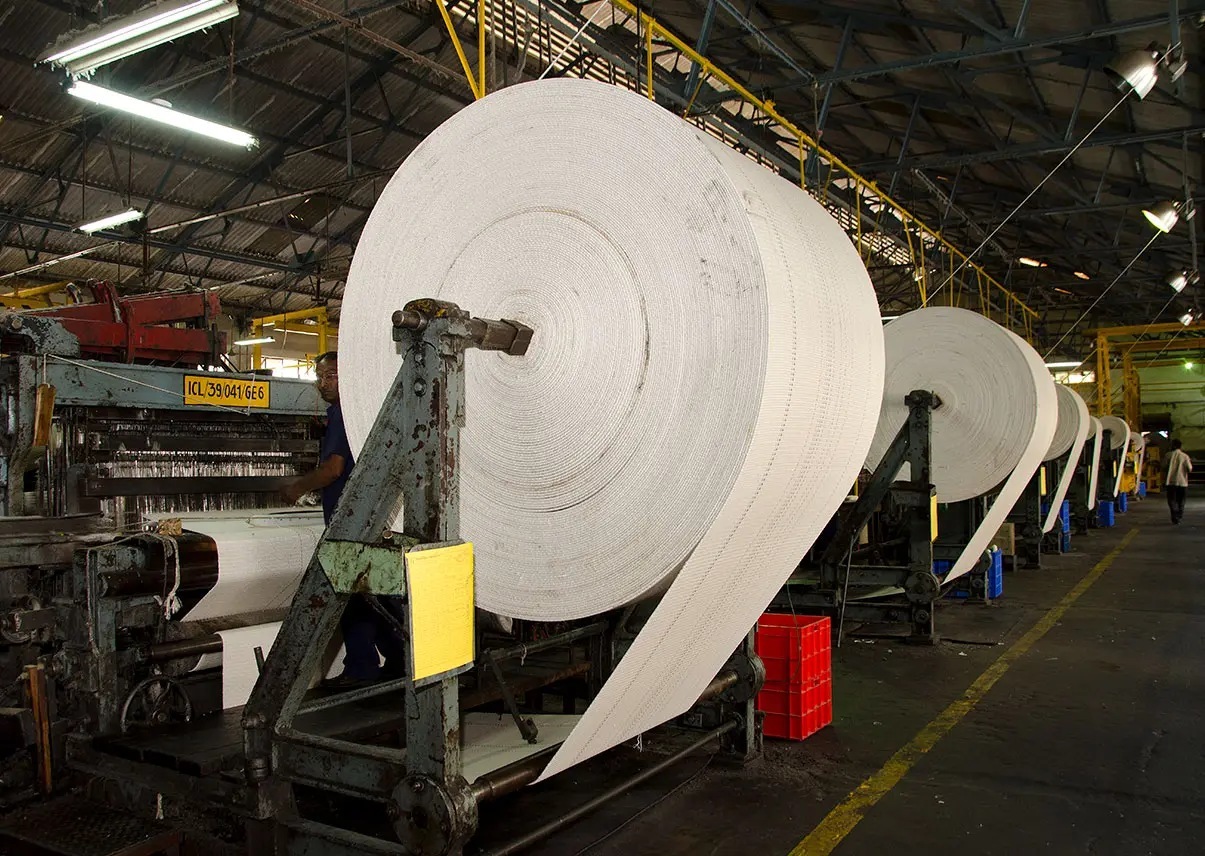
International Conveyors is essentially the corporate equivalent of building high-tech treadmills for the planet’s heaviest materials. They are India’s only listed manufacturer of PVC fire-resistant, antistatic solid woven conveyor belting—a critical, high-friction consumable used to transport bulk materials like coal, potash, and salt out of deep underground mines without triggering catastrophic explosions.
The corporate structure operates across three distinct business buckets:
Conveyor Belting: The heavy industrial core, accounting for 94% of operational revenues, producing specialized high-tensile belts up to Type 18 strength.
Wind Energy: A small legacy green energy play with 5 wind turbine generators generating 109 lakh KWH, mostly to offset operational consumption.
The Treasury Arm: A massive, hyper-active investment division that behaves less like an industrial manufacturer and more like a restless hedge fund, throwing cash into listed equities, mutual funds, and inter-corporate deposits.
Though they serve marquee global giants like Nutrien and BHP Billiton, they suffer from intense customer concentration risk, with just six buyers locking up 71% of total revenues. It is a high-barrier business with tedious 5-to-7-year regulatory approval cycles, meaning once you are in, you are sticky. But when your primary end-markets face cyclical downturns, your industrial engine stalls, leaving your treasury portfolio to do the heavy lifting.
Financials Overview
Figures are consolidated, in ₹ crore.
Quarterly Financial Performance
Metric
Latest Quarter (Mar 2026)
YoY
QoQ
Revenue
97.03
77.71%
174.56%
EBITDA / Operating Profit
18.63
791.39%
246.93%
PAT
3.99
-34.27%
-86.56%
EPS (₹)
0.63
-34.38%
-86.45%
The headline numbers for the March 2026 quarter present an extraordinary operational paradox. Quarterly revenue exploded by 77.71% year-on-year to ₹97.03 crore, and operating profit staged an apparent comeback, surging to ₹18.63 crore from a measly ₹2.09 crore in the previous year’s matching quarter. Yet, actual net profit collapsed by 34.27% over the same period to