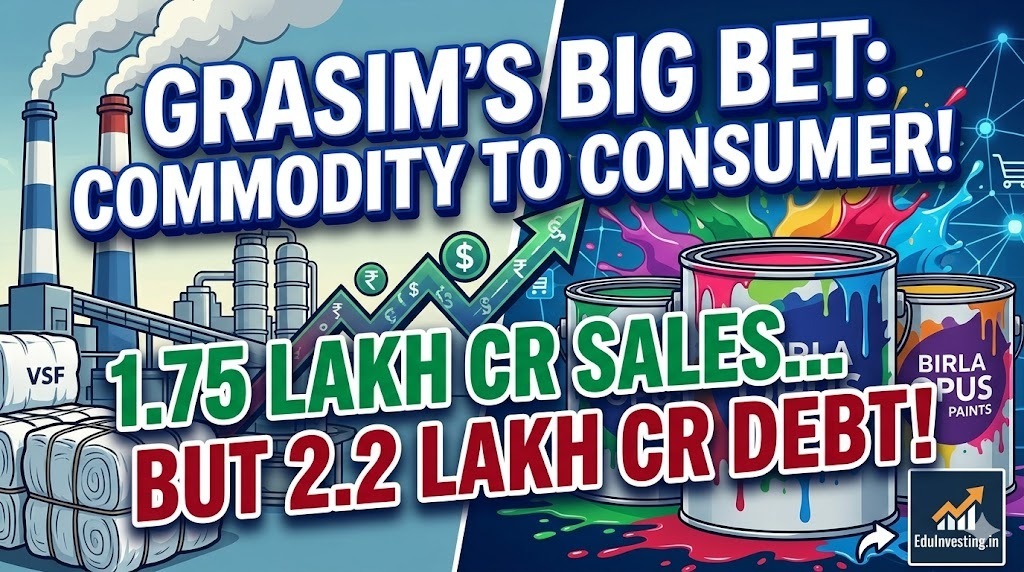
Grasim Industries Ltd Mar 2026 : A Massive 1.75 Lakh Crore Top-Line Chasing 2.2 Lakh Crore Borrowings
Section 1 — At a Glance
Grasim Industries Ltd closed the financial year 2026 with an all-time high consolidated revenue from operations of ₹1,75,431 crore, marking a robust 18.15% top-line expansion against the prior year’s ₹1,48,478 crore. While the headline numbers indicate scaling volumes and an ambitious push into new growth engines, the company’s profitability continues to bear the structural strain of aggressive capital deployment. Consolidated Profit After Tax (PAT Owners Share) stood at ₹4,966.48 crore , up from ₹3,705.68 crore in the preceding year, yet heavily reliant on financial services momentum and stable cement upstreaming rather than its traditional manufacturing core.
Investor attention is laser-focused on the spectacular market share gains of the newly launched decorative paints brand, Birla Opus, which expanded its footprint rapidly to cross a 10% revenue market share in March 2026. Similarly, the B2B e-commerce wing, Birla Pivot, is scaling at breakneck speed, nearly touching an annual revenue run-rate of ₹8,500 crore. However, this expansion comes at an eye-watering cost. Total borrowings on the consolidated balance sheet have ballooned to a colossal ₹2,27,853.06 crore, driven primarily by the intensifying financialization of the lending book alongside extensive manufacturing capex. Operating profitability remains a delicate balancing act, as severe raw material cost inflation, input price volatility, and massive gestation period losses from new incubations drag down margins. Aggressive scale built on thin margins exposes a corporate structure to intense macroeconomic shocks. The critical question remains whether these multi-billion-dollar bets can achieve self-sustaining profitability before the weight of capital servicing catches up.
Section 2 — Introduction
Grasim Industries Ltd, the highly diversified flagship entity of the Aditya Birla Group, occupies a uniquely complex position in the Indian corporate landscape. Historically anchored in industrial manufacturing commodities—such as Viscose Staple Fibre (VSF) and Chlor-Alkali chemicals—Grasim has spent the last few years aggressively transforming itself into a consumer-facing, digital-first powerhouse.
This article unpacks the structural reality behind the numbers up to the quarter and fiscal year ended March 31, 2026. Grasim currently functions as a split personality: part stable commodity giant, part ultra-aggressive incubator of new-age businesses like Birla Opus paints and the Birla Pivot platform, and part holding company for massive subsidiaries like UltraTech Cement and Aditya Birla Capital. With a management transition underway following the appointment of Mr. Himanshu Kapania as Managing Director, and significant equity restructuring after a massive ₹4,000 crore rights issue, the stakes have never been higher for this multi-industry behemoth.
Section 3 — Business Model: WTF Do They Even Do?
To the smart but lazy investor, looking at Grasim’s consolidated financials feels like looking at an optical illusion. Standalone operations focus on its traditional cash cows: Cellulosic Staple Fibre (CSF), where it holds dominant domestic leadership, and Chlor-Alkali chemicals (caustic soda), where it sits comfortably as India’s largest producer.
However, its consolidated identity is a completely different animal, split into distinct buckets:
Building Materials (Cement & Paints): Comprises a 56.11% stake in UltraTech Cement (the world’s third-largest producer outside China) and the newly minted Birla Opus paints, backed by an initial ₹10,100+ crore industrial footprint.
Financial Services: Anchored via Aditya Birla Capital, managing a massive ₹2,07,368 crore lending book.
B2B Digital Platform: Birla Pivot, which basically digitizes fragmented building material procurement for MSMEs.
Essentially, Grasim takes the cash generated from selling industrial chemicals and fabric raw materials, layers on heaps of debt, and pumps it into fighting legacy consumer champions and funding financial loan books.
Section 4 — Financials Overview
Figures are consolidated, in ₹ crore.
Comparison Table (Quarterly Results)
Metric
Latest Quarter (Mar 2026)
YoY (%)
QoQ (%)
Revenue from Operations
₹51,101.11
+35.44%
+15.32%
Operating Profit (EBITDA)
₹10,876.06
+37.81%
+22.62%
PAT (Owner’s Share)
₹1,957.74
+30.88%
+88.86%
Reported EPS (₹)
₹28.77
+38.32%
+88.90%
The top-line momentum in the final quarter of fiscal year 2026 was undoubtedly explosive, driven by seasonally strong demand cycles across building materials and peak utilization in the e-commerce channels. Consolidated revenue crossed the ₹51,000 crore mark in a single quarter, reflecting deep physical volume traction. However, a line-by-line inspection