AYM Syntex FY26: The 191x P/E Optical Illusion and a Promoters’ Great Consolidation
Section 1 — At a Glance
AYM Syntex presents an intriguing case where headline trailing metrics can mask underlying core corporate transformations. At first glance, a statutory Net Profit of ₹6.56 crore against a Market Capitalization of ₹1,250.15 crore flags an astronomical trailing P/E multiple of 190.57x. However, a deeper look reveals a business working through significant changes, including a major ₹141.76 crore capital infusion and an ongoing operational consolidation via an NCLT-supervised corporate merger.
Investor focus is currently drawn to a strong recovery in quarterly performance. In the final quarter of the fiscal year ending March 31, 2026, standalone net profit surged to ₹9.03 crore, climbing from ₹2.03 crore in the corresponding quarter of the previous year. This improvement comes alongside the ongoing operational integration of Mandawewala Enterprises Limited, aimed at streamlining the organizational setup.
However, certain areas require closer monitoring. Total annual revenue experienced a moderate contraction, easing to ₹1,365.12 crore from ₹1,489 crore in the prior fiscal year. Profitability margins also faced headwinds, with the annual Operating Profit Margin settling at 6.81% due to demand adjustments and pricing pressures across global textile supply chains.
A high headline P/E ratio driven by a cyclical or event-driven dip in trailing earnings can sometimes obscure a company’s underlying asset base or ongoing structural improvements.
The primary questions ahead center on whether the company’s recent capacity expansions in higher-margin specialized yarn segments will optimize utilization rates, and how effectively the upcoming amalgamation will translate into visible balance-sheet efficiencies.
Section 2 — Introduction
AYM Syntex Limited, established in 1983, occupies a specialized niche within the synthetic textile industry, focusing on the production and export of multi-polymer technical yarns, nylon filament yarns, and bulk continuous filament (BCF) yarns. Over the last few years, the company has transitioned away from its historic joint promoter structure. It is now managed under the leadership of Rajesh Mandawewala, co-promoter of the Welspun Group, marking a distinct strategic shift.
This analysis comes at a notable juncture. On May 25, 2026, the company held its NCLT-convened meetings for equity shareholders and unsecured creditors, securing approvals for the formal amalgamation of Mandawewala Enterprises Limited into AYM Syntex. Backed by a major ₹141.76 crore preferential equity fundraising round completed during the fiscal year, the corporate structure is being consolidated. This review looks past temporary shifts in trailing net margins to evaluate the company’s evolving operating leverage, capital structure, and fundamental asset base.
Section 3 — Business Model: WTF Do They Even Do?
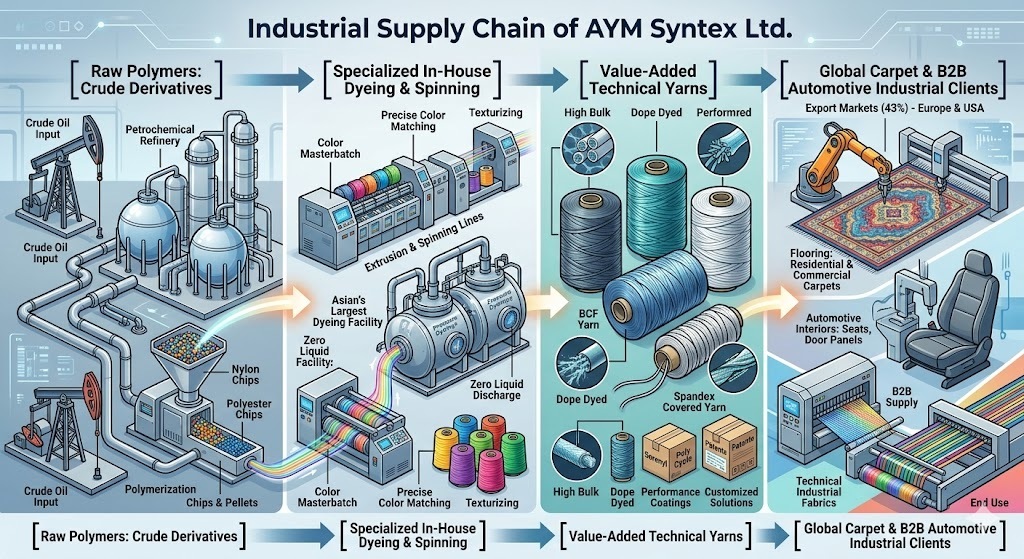
AYM Syntex operates primarily in the specialized, B2B technical textiles sector rather than mass-market apparel. The business focuses on manufacturing customized synthetic yarns designed for demanding, long-life applications, including residential and commercial carpets, rugs, bath mats, automotive interiors, and technical industrial fabrics.
The company provides an extensive portfolio of over 18,000 color shades alongside proprietary brands like Sorenyl, Rezilia, and Poly Cycle. Operating from two manufacturing facilities in Palghar, Maharashtra, and Silvassa/Naroli, the business maintains an annual production capacity of 102.8 K MT.
Rather than relying entirely on highly competitive domestic textile markets, the company has diversified geographically. In FY25, export markets accounted for 43% of total revenue, supplying international carpet and contract flooring manufacturers across Europe and North America. This specialization helps buffer the business from standard clothing retail cycles, but it exposes operations directly to fluctuations in global industrial demand and crude-linked raw polymer costs.