Indo SMC Ltd H2 FY26: The ₹310 Crore SME Flying Machine Facing a Disappearing Cash Trick
Section 1 — At a Glance
When an industrial smallcap ramps its top-line from under a crore to over ₹309 crore in a span of four fiscal years, the market naturally halts to look. Indo SMC Ltd has managed precisely this spectacular trajectory, clocking a massive ₹309.74 crore in sales for FY26 compared to just ₹28.03 crore in FY24. Its net profit performance has similarly surged from ₹3.00 crore to ₹32.38 crore over the same two-year horizon. This dramatic operational acceleration has catapulted investor interest, driven by a robust macro environment pushing for specialized Sheet Moulding Compound (SMC) electrical enclosures, smart metering components, and infrastructure-grade Fiberglass Reinforced Plastic (FRP) structures.
Yet, underneath this explosive top-line momentum lies a series of structural bottlenecks that should prevent anyone from celebrating blindly. While the company’s operating profit margins have adjusted down slightly to 15.1% as its product mix shifted toward bulk power distribution infrastructure, it is the balance sheet’s working capital consumption that demands strict monitoring. Indo SMC remains completely incapable of translating book accounting profits into actual, touchable bank balances from its underlying operations. In fact, operating cash flows have deteriorated from negative ₹5.78 crore to negative ₹34.77 crore as inventory stockpiles ballooned exponentially. High top-line growth that eats cash faster than it yields returns is structurally vulnerable. Investors are currently staring at a business that is flying operationally, but funding its spectacular ascent entirely through fresh equity dilution and capital market infusions rather than organic cash generation.
Section 2 — Introduction
Indo SMC Ltd represents a classical example of a newly listed corporate entity capitalizing on India’s current power sector upgrade cycle. Having successfully executed its initial public offering (IPO) and subsequent listing on January 21, 2026, the organization raised ₹87 crore of fresh growth capital. This equity injection arrived at a critical juncture, intended primarily to bankroll manufacturing machinery upgrades and address a growing working capital deficit.
The primary catalyst for evaluating the company at this precise point is the publication of its audited H2 FY26 and full-year results ending March 31, 2026. The financial print reveals an organization transitioning rapidly from a regional boutique manufacturer into a multi-facility industrial player. However, rapid structural transitions inside an SME business often introduce severe strains on executive execution and capital efficiency. As we deconstruct the numbers, the underlying narrative changes from a simple story of volume expansion to a meticulous game of working capital stewardship.
Section 3 — Business Model: WTF Do They Even Do?
Indo SMC operates at the intersection of material science and electrical grid infrastructure. Stripping away the technical jargon, they specialize in blending chemical compounds and plastics to replace conventional steel in hazardous or highly corrosive utility environments. Their product architecture is split across three key operational segments:
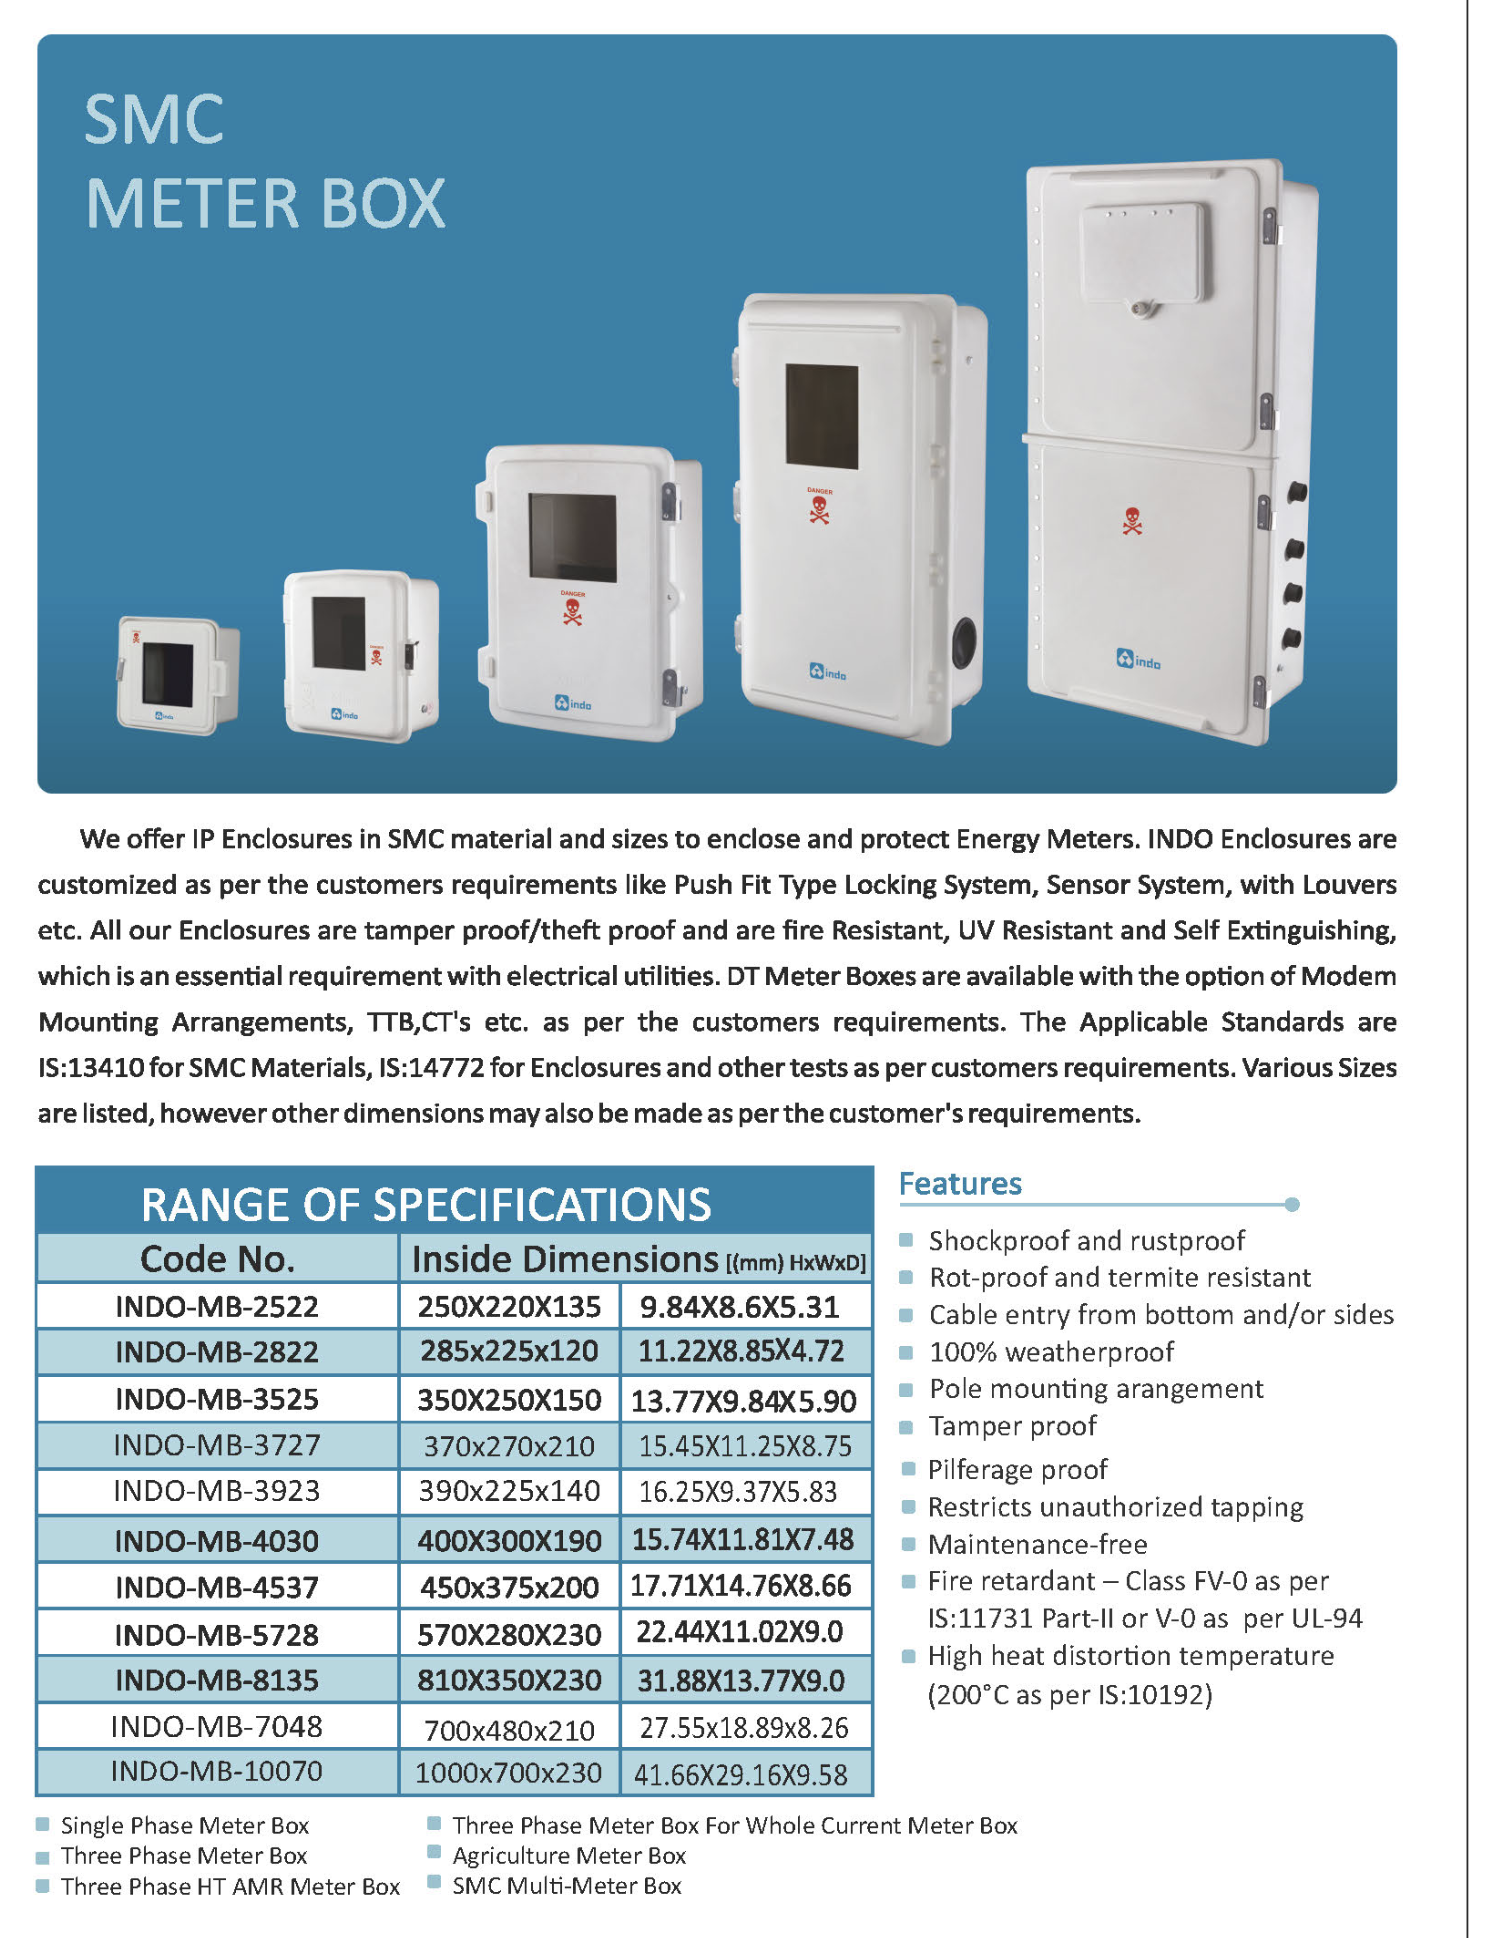
SMC Division (~49% of FY25 revenue): Compounding and hot-pressing weather-resistant, anti-tamper enclosure boxes for utility energy meters and electrical distribution systems.
FRP Division (~21% of FY25 revenue): Fabricating lightweight structural profiles, cable trays, and industrial floor gratings that extend infrastructure shelf-life in harsh chemical or coastal environments.
Electrical Components: Producing high-tension and low-tension current and potential transformers (CT/PT sets), switchgears, and newly introduced high-performance bus ducts.
The commercial engine is anchored heavily to public infrastructure, with government utilities and engineering, procurement, and construction (EPC) contractors accounting for approximately 60% of total demand. It is a classic B2B model characterized by high concentration risks: a single client accounted for a staggering 65% of orders recently, and the top ten customers command 83% of the business.
Section 4 — Financials Overview
Figures are consolidated, in ₹ crore.
Comparison Table
Metric
Latest H2 FY26
YoY (H2 FY25)
Previous H1 FY26
Revenue
197.20
68.93
112.54
EBITDA / Operating Profit
29.85
7.79
17.80
PAT
20.93
4.71
11.45
EPS (Reported, ₹)
9.16
2.82
5.01
The absolute top-line expansion in H2 FY26 is undeniably vast, jumping 186% year-on-year against the prior fiscal’s second half. This surge reflects the strong historical seasonality pattern within industrial utility suppliers; tender execution and billings scale aggressively into the final two quarters of the fiscal year, while the first half remains plagued by monsoon disruptions. However, this growth has fundamentally cost the business some of its pricing power. Full-year operating profit margins contracted down to 15.1% from the historical peak of 18% seen in FY24, an undeniable consequence of low-margin bulk bus duct orders dragging the mix downward. Net profit margins achieved temporary padding via structural tax adjustments in the current period, with PAT hitting ₹20.93 crore for the half-year.
What is Management Promising in the Coming Quarters?