Tata Consumer Q4 FY26: The ₹20,000 Crore Milestone Crossed, but the US Coffee Mug Runs Bitter
Section 1 — At a Glance
Tata Consumer Products Ltd has breached the ₹20,000 crore annual sales frontier, delivering a consolidated revenue of ₹20,290.43 crore for FY26. This represents a robust 15.17% growth over the previous year, backed by an impressive 13% underlying volume growth (UVG) in its domestic portfolio. Net profit for the full year climbed to ₹1,542.30 crore, while the newly introduced management metric of Adjusted EPS—which neutralizes acquired-brand amortization—landed at ₹17.30, providing a cleaner lens on structural profitability.
While investor attention is firmly anchored to the stellar performance of the domestic growth engines, structural worries persist. The flagship India Tea business saw a marginal revenue decline of 1% in Q4 FY26, as the company aggressively passed through commodity cost deflation via customer price cuts. Simultaneously, input cost inflation has migrated across borders. Elevated green coffee prices in the US squeezed international branded gross margins, causing International EBITDA to drop 10% in constant currency terms for the full fiscal year. Compounding the operational friction, severe geopolitical and shipping disruptions in the Middle East throttled international export shipments during March.
Operating efficiency remains a double-edged sword; capital efficiency is structurally suppressed, as the high goodwill from a string of recent inorganic acquisitions leaves Return on Capital Employed (ROCE) locked at a modest 9.24%.
When structural growth is heavily funded by inorganic goodwill, true capital efficiency requires massive operational scale to outrun balance-sheet amortization.
The upcoming quarters will serve as a definitive litmus test: can the domestic route-to-market architecture sustain a premiumization trajectory fast enough to outpace international commodity headwinds?
Section 2 — Introduction
The corporate avatar of Tata Consumer Products has evolved far beyond its ancestral roots as a pure-play plantation and bulk-tea business. Today, it stands as a consolidated fast-moving consumer goods behemoth, aggressively aggregating brands across pantry staples, health and wellness, and alternative proteins. The primary catalyst for this current deep-dive analysis is the closure of the FY26 financial year, alongside a sweeping corporate overhaul.
Over the past twelve months, the company successfully completed the structural amalgamation of three wholly owned subsidiaries, completed a massive ₹3,000 crore rights issue to completely extinguish the bridge loans used to buy out Capital Foods and Organic India, and executed a radical re-architecting of its pan-India distribution network. This report unpacks whether this extensive financial engineering translates into a genuine competitive moat or simply a larger, more complex matrix to manage.
Section 3 — Business Model: WTF Do They Even Do?
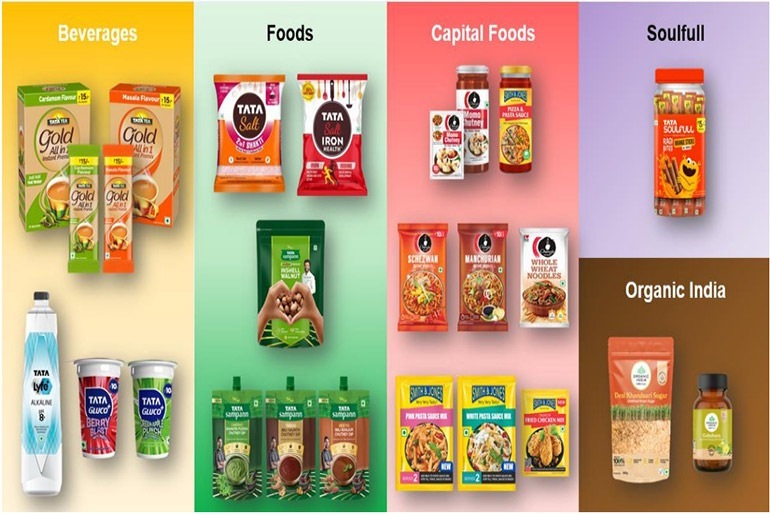
At its core, Tata Consumer behaves like a giant diversified funnel, sucking in unbranded agricultural commodities—tea leaves, coffee beans, and raw industrial salt—and pumping them out as branded consumer products commands a steep pricing premium. The domestic revenue engine is now perfectly balanced between India Beverages (32%) and India Foods (32%), with International operations contributing 24% and unbranded solubles accounting for the residual 12%.
The operational plumbing relies on a massive infrastructure network comprising 132 manufacturing plants globally and a retail distribution footprints spanning 4.5 million outlets across India. To keep smart but lazy investors happy, management breaks the operations into two distinct internal buckets: the Core Portfolio (comprising market leaders like Tata Tea and Tata Salt) which acts as a predictable cash cow, and the Growth Portfolio (comprising Tata Sampann staples, NourishCo ready-to-drink beverages, Ching’s Secret, and Organic India) designed to capture high-margin, high-frequency consumption occasions.
Section 4 — Financials Overview
Figures are consolidated, in ₹ crore.
Quarterly Performance Comparison
Metric
Q4 FY26
YoY (%)
QoQ (%)
Revenue
₹5,433.62
+38.37%
+6.29%
EBITDA / Operating Profit
₹792.41
+25.86%
+9.95%
PAT
₹419.08
+93.45%
+8.96%
EPS (Reported)
₹4.24
+93.61%
+8.99%
Note: Sourced directly from raw quarterly financial data ledger. YoY comparison evaluates Q4 FY26 against Q4 FY25; QoQ evaluations contrast Q4 FY26 against Q3 FY26.