Hester Biosciences FY26: A ₹55 Crore PAT Mirage or Gen Genuine Biological Turnaround?
Section 1 — At a Glance
Hester Biosciences Limited closed the fiscal year ending March 31, 2026, with a consolidated revenue from operations of ₹332.60 crore, representing a growth of 6.91% over the ₹311.10 crore recorded in FY25. The headline net profit for the year experienced a sharp upward surge of 102.40%, scaling from ₹27.49 crore in the previous fiscal to ₹55.64 crore. This dramatic bottom-line spike has captured significant investor attention, as it is accompanied by an expansion in operating profit to ₹87.16 crore, up from ₹62.05 crore in FY25, pushing the operating profit margin to 26.21%.
However, a deeper evaluation reveals structural nuances that require analytical sobriety. The massive bottom-line expansion was heavily supported by an exceptional financial income of ₹18.99 crore under other income, primarily driven by a strategic capital allocation exercise involving the divestment of a 43.81% stake in its subsidiary, Texas Lifesciences Private Limited, for ₹9.20 crore. On the operating side, the primary growth engine remains the poultry healthcare vertical, which grew 21% in FY26, driven by deeper market penetration and the pivotal licensing of the inactivated H9N2 Avian Influenza vaccine. Conversely, the animal healthcare business continued to grapple with extreme tender-timing volatility within domestic vaccination programs and delayed project implementations across African subsidiaries.
Extraordinary non-operating windfalls can temporarily illuminate a corporate bottom line, but long-term investment survival requires assessing the stark, unvarnished efficiency of the core operational machinery.
With the capitalization of its domestic Fill-Finish and specialized biological processing lines, the investment thesis now shifts entirely away from capital expenditure execution toward asset utilization capacity.
Section 2 — Introduction
Hester Biosciences Limited has evolved from a single-vaccine trading entity established in 1987 into a prominent animal health enterprise with a manufacturing footprint spanning India, Nepal, and Tanzania. The company serves a specialized niche within veterinary biologicals, generating international and domestic volume from critical livestock treatments.
This comprehensive analysis is timed precisely with the formal conclusion of their FY26 capital cycle, marked by the commissioning of major capacity expansions and a strategic corporate restructuring of peripheral assets. As management transitions the organization from a debt-heavy investment phase to an asset-sweeping run rate, we examine whether the company can translate its global market share into consistent, high-velocity cash flows for public shareholders.
Section 3 — Business Model: WTF Do They Even Do?
Hester Biosciences operates a biologicals-heavy veterinary wellness model designed to protect animal assets from high-mortality disease outbreaks. To put it simply, they prevent financial catastrophe for commercial poultry farmers and rural livestock owners by manufacturing high-volume, low-cost preventative treatments.
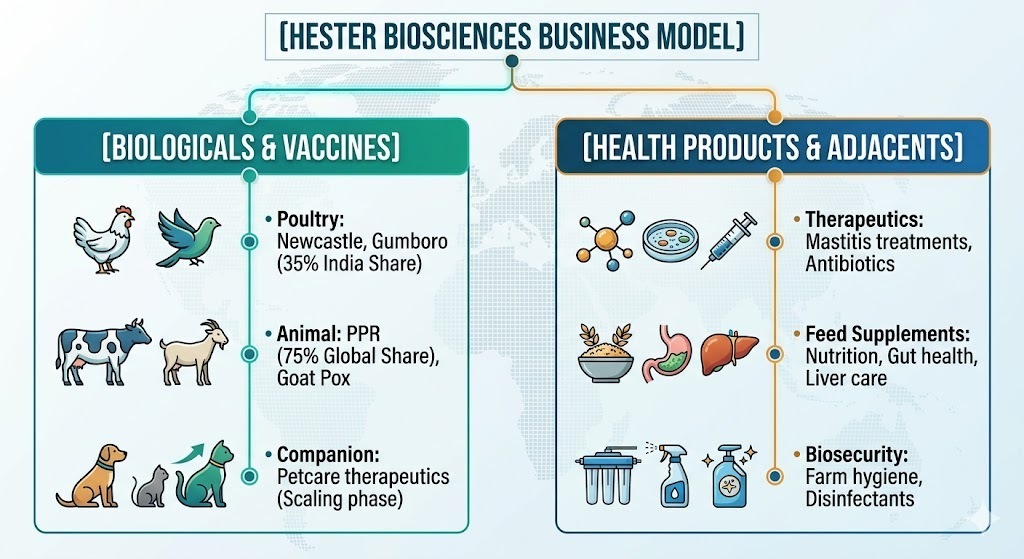
The corporate revenue engine is split across three key segments:
Poultry Healthcare (~62% of Consolidated Revenue): Supplies over 50 live and inactivated vaccines covering Newcastle and Marek’s diseases. Hester controls a 35% domestic market share in India, positioning it as the second-largest player nationally.
Animal Healthcare (~38% of Consolidated Revenue): Focuses on large and small ruminants, manufacturing critical institutional vaccines such as Goat Pox and Peste des Petits Ruminants (PPR). It commands a dominant 75% global market share in PPR vaccines and a 70% share in domestic Goat Pox solutions.
Petcare: A nascent division supplying companion animal therapeutics and supplements across 15 operational sales territories, although it currently carries zero commercialized pet vaccines.
The manufacturing infrastructure relies on an aggregate capacity of 8.60 billion doses in Kadi (Gujarat), 1.24 billion doses in Nepal, and 1.50 billion doses in Africa (Tanzania). The revenue distribution leans heavily toward the domestic Indian market, which contributes 86% of turnover, while global exports make up the remaining 14%.
Section 4 — Financials Overview
Figures are consolidated, in ₹ crore.
Performance Comparison Table
Metric
Full Year FY25
Full Year FY26
YoY Change (%)
Revenue from Operations
311.10
332.60
6.91%
EBITDA / Operating Profit
62.05
87.16
40.47%
Profit After Tax (PAT)
27.49
55.64
102.40%
Earnings Per Share (EPS) (₹)
32.31
65.41
102.45%
Financial Performance Commentary
The 6.91% top-line expansion understates the significant changes inside the profit and loss ledger. Operating profit surged by 40.47% due to a favorable shift toward higher-margin poultry biologicals and strict operational cost containment, which lowered raw material input constraints. Total employee expenditures were successfully held flat at ₹62.67 crore.
However, the final PAT lines were significantly distorted by the booking of ₹18.99 crore in other income, creating a sharp 102.40% optical jump that operational reality alone cannot sustain. On a quarterly run-rate basis, Q4 FY26 sales reached ₹100.11 crore, achieving an operating profit of ₹34.33 crore, which highlights a strong seasonal finish to the fiscal year.
Relying on aggregate quarterly performance trends without isolating one-time accounting events can