Tokyo Plast International Q4 FY2026: The Plastic Thermoware Paradox — Shrinking Profits While Revenue Plays Hide and Seek
Date of Publishing -
Spotted a factual error — a wrong number, date, or fact? Tell us and we will check the source.
1. At a Glance
Tokyo Plast International just reported audited FY2026 results, and here’s where the story gets uncomfortable. The company posted consolidated revenue of ₹79.31 crore for the full year, a reasonable 9.4% expansion from ₹72.47 crore in FY2025. But take a closer look at the bottom line: profit after tax collapsed 51.2% year-over-year to just ₹0.63 crore. That’s not a slowdown. That’s a cliff.
The company makes thermoware products—lunch boxes, coolers, casseroles—stuff most Indian households own. Export-heavy (around 70% of revenue), it even holds Star Export House status from the government. Sounds respectable on paper. But the numbers tell a different story: margins are evaporating, profitability is vanishing, and the balance sheet is starting to show strain from rising debt levels.
Here’s what makes this particularly interesting. Q4 FY2026 itself shows quarterly sales of ₹22.88 crore (up 33.3% year-over-year), yet quarterly profit crashed 91.7% to just ₹0.04 crore. How does revenue jump a third while profit nearly disappears? Welcome to the operating leverage paradox of a company struggling with cost control and rising debt servicing costs.
The stock trades at a P/E of 139 on annualised earnings—a valuation that screams distress. The company’s return on equity sits at a pathetic 1.01%, and ROCE is barely above 4%. Yet the promoters hold a firm 68.82% stake, and no dividend has been paid since inception. The question isn’t whether Tokyo Plast is a great business—it clearly isn’t. The question is whether it’s turned into a distressed value play or a potential turnaround candidate. The evidence so far leans toward the former.
2. Introduction
Tokyo Plast International Limited has been manufacturing plastic thermoware products since 1992—three decades in a business that should be straightforward: make containers, coolers, and lunch boxes; export them globally. Yet recent results expose a company caught in a profitability trap.
The FY2026 full-year results, approved on April 29, 2026, reveal a troubling pattern. While revenue grew 9.4% to ₹79.31 crore (standalone: ₹79.31 crore), consolidated net profit halved from ₹1.31 crore to ₹0.63 crore. Operating margins compressed to 8.76% from 9.09% in FY2025. The company is selling more but earning significantly less.
Q4 specifically (the quarter ended March 31, 2026) shows the dysfunction clearly. Sales rose 33.3% quarter-on-quarter to ₹22.88 crore. But quarterly profit fell 91.7% to ₹0.04 crore. This gap between revenue growth and profit contraction is the central mystery we need to unpack.
The immediate culprits are visible in the P&L: finance costs jumped from ₹2.12 crore in FY2025 to ₹2.86 crore in FY2026—a 35% increase. Depreciation rose modestly from ₹2.96 crore to ₹3.05 crore. But the real killer is the cost of materials and operating expenses which, when combined with the rising debt burden, squeezed margins.
Beyond the numbers, there are whispers of corporate action. The company approved the sale of an Andheri property for ₹15.01 crore in November 2025 (with 99.9982% shareholder approval in December 2025). The question investors should ask: Is management raising cash because it needs it, or because it sees a genuine opportunity? The CRISIL rating (BB+/Stable) suggests the former.
3. Business Model: WTF Do They Even Do?
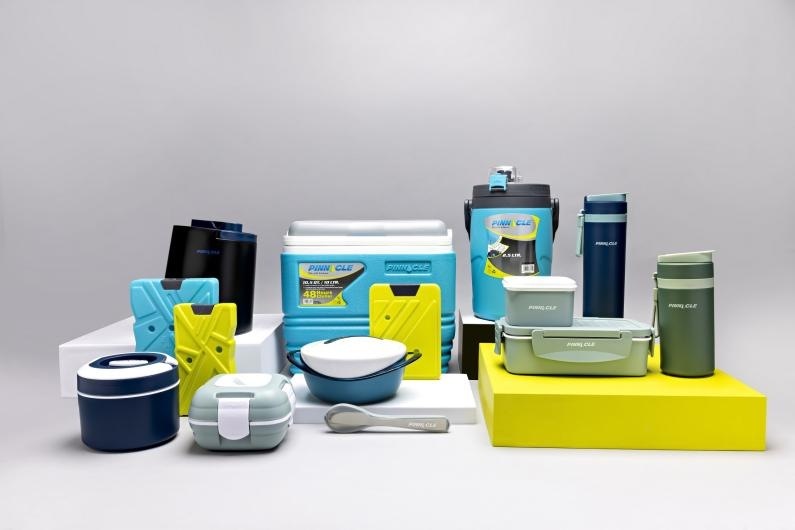
Tokyo Plast manufactures plastic thermoware products—thermoware being insulated containers designed to keep food hot or cold. The product range includes lunch boxes, ice coolers, insulated casseroles, food bowls, and gift sets. Think of them as the plastic cousins of expensive vacuum-sealed containers, but priced for mass consumption.
The business model is export-oriented. The company is a Star Export House recognized by the Indian government and exports to 75+ countries, with major markets in the US, Latin America, Germany, France, Belgium, Spain, Australia, and Benin. Export sales constitute roughly 70% of total revenue, while domestic sales make up the remainder.
Manufacturing happens across two plants: one at Kandla (specializing in water jugs and cooler boxes) and one at Daman (focusing on casseroles and food warmers). The company markets products under the Pinnacle brand, which is patented and registered in 50+ countries.
Here’s the problem with this model. The thermoware market is crowded, price-sensitive, and increasingly competitive. Export markets are mature and face pricing pressure from Chinese competitors and local substitutes. Domestic demand is growing but fragmented. The company sells to end-consumers through retail channels and B2B customers, but without strong brand equity in the consumer’s mind, margins are perpetually under assault.
The FY2025 annual report shows export revenue as approximately ₹51.8 crore (71.5% of total), with domestic at ₹20.67 crore (28.5%). This heavy export reliance introduces currency volatility, shipping cost exposure, and tariff sensitivity—none of which the company can control.
Finished goods account for roughly 95% of revenue, with traded goods making up the rest. This suggests limited vertical integration and reliance on external procurement, which keeps the company vulnerable to raw material price fluctuations.
In essence, Tokyo Plast is a manufacturer caught in a low-margin, export-dependent business competing on price and volume rather than differentiation or brand power. That’s a tough place to be when your costs are rising and your customers are getting more demanding.
4. Financials Overview: The Margin Murder Mystery
Let me walk you through the core P&L numbers first.
Annual Financials (Consolidated):
Metric
FY2026
FY2025
YoY Change
Q4 FY2026
Q4 FY2025
QoQ
Sales (Cr.)
79.31
72.47
+9.4%
22.88
17.14
+33.3%
EBITDA (Cr.)
7.00
8.59
-18.6%
2.50
2.32
+7.8%
PAT (Cr.)
0.63
1.31
-51.2%
0.04
0.51
-91.7%
OPM (%)
8.76%
9.09%
-33 bps
7.56%
8.98%
-142 bps
Net Margin (%)
0.79%
1.81%
-102 bps
0.17%
2.97%
-280 bps
EPS (₹)
0.66
1.38
-52.2%
0.04
0.51
-91.7%
Annualised EPS Calculation (FY2026): Since FY2026 is a full-year result (not a quarterly annualisation), the EPS of ₹0.66 is the actual reported full-year figure. No annualisation needed.
Year-on-Year Comparison:
FY2026 shows the dual trap. Revenue grew 9.4%, which is healthy. But operating margin fell 33 basis points (from 9.09% to 8.76%), and net margin compressed by 102 basis points (from 1.81% to 0.79%). The company is selling more volume but earning progressively less per rupee of sales.
The culprit is visible in the expense section. Cost of materials consumed as a percentage of sales rose from 49.1% (FY2025) to 51.6% (FY2026). Raw material costs pushed up, likely driven by plastic resin price inflation and supply chain pressures. Finance costs, as mentioned, jumped 35% to ₹2.86 crore. Together, these two factors eroded profitability.
Q4 Specifics:
Q4 FY2026 is where the real pain shows. Sales surged 33.3% QoQ (₹22.88 crore vs. ₹17.14 crore in Q3), but quarterly profit fell 91.7% (₹0.04 crore vs. ₹0.51 crore). This suggests Q4 was a high-volume, low-margin quarter—possibly driven by order fulfillment deadlines or customer demand bunching. The operating margin in Q4 dropped to 7.56% from the prior quarter’s 8.98%.
The Walking the Talk Test:
CRISIL’s November 2025 rating report noted that management had “subsequently started sharing the information required for carrying out a comprehensive review” after a period of non-cooperation. This suggests prior transparency issues. The debt situation (rising from ₹26.89 crore in Mar 2025 to ₹48.38 crore in Mar 2026) would have needed explaining by management, and the property sale signals urgent cash needs.
5. Valuation Discussion: Fair Value Range Only
I’ll employ three valuation methods to establish a reasonable range.
Method 1: Price-to-Earnings (P/E) Multiple
Current Market Data:
Current Price: ₹92.0
EPS (FY2026): ₹0.66
Market P/E: 139.4x
Industry Median P/E: 21.83x
Normalised P/E Approach: Using the industry median P/E of 21.83x as a normalised multiple:
Fair Value (P/E) = ₹0.66 × 21.83 = ₹14.41 per share
This suggests significant downside from the current price, reflecting the market’s distress premium on this stock.
Method 2: EV to EBITDA
Current Data:
Enterprise Value: ₹130 Cr.
EBITDA (FY2026): ₹7.00 Cr.
Current EV/EBITDA: 18.57x
Industry Median EV/EBITDA: 11.34x (from peer comparison)
Fair Value (EV/EBITDA): Using normalised EV/EBITDA of 11.34x:
Given persistent negative FCF in the near term due to capex requirements (the company has ₹28.27 crore in CWIP, suggesting ongoing factory expansion), a traditional DCF becomes problematic.
Alternative DCF Valuation (Turnaround Scenario): Assuming capex moderates after Year 2 and FCF turns positive:
PV of FCF (Years 1-5, assuming recovery by Year 3): ₹15-18 Cr. (discounted)
This DCF scenario actually yields negative equity value, which means the debt overhang is crushing intrinsic value. This is a critical warning sign.
Fair Value Range Summary:
Method
Fair Value (Per Share)
P/E Multiple (21.83x)
₹14.41
EV/EBITDA (11.34x)
₹32.66
DCF (Turnaround, if capex moderates)
₹8-12 (highly uncertain)
Suggested Fair Value Range: ₹14 – ₹33 per share
The wide range reflects uncertainty around the company’s ability to stabilise margins and manage its capex burden. The upper end assumes margin normalisation; the lower end assumes continued distress.
Disclaimer: This fair value range is for educational purposes only and is not investment advice. Valuations are sensitive to assumptions about future margins, capex requirements, and interest rate costs. The company’s heavy capex agenda (CWIP of ₹28.27 crore) suggests management is betting on future growth, but returns on this capex are not yet visible.
6. What’s Cooking: News, Triggers, Drama
The Property Sale: A Bullish Signal or a Cry for Help?
In November 2025, the board approved the sale of the company’s Andheri (Mumbai) property for ₹15.01 crore. This was blessed by 99.9982% of shareholders in a December EGM. On the surface, this could be management unlocking trapped value in real estate. In reality, it signals cash stress.
Why? Because selling an office property doesn’t usually happen when a company is flush. Andheri real estate is valuable, yes, but it’s also the company’s administrative headquarters. Selling it suggests either (a) relocation to cheaper space, or (b) urgent need for liquidity. Given the balance sheet deterioration (debt jumped from ₹26.89 crore to ₹48.38 crore in one year), I’m leaning toward option (b).
This cash will likely be used to service rising debt and fund the capex already under way. It’s not a sign of strength.