Trent Ltd:
₹5,345 Cr Revenue. 30.7% ROCE.
Fashion Retail’s New Flavour of Growth
₹1,164 stores across 274 cities. 15.8 million sq ft of retail space. A P/E at 79.9x that makes you wonder if this is Amazon’s secret Indian cousin or just a very, very confident Zudio.
The Retail Empire That’s Actually Making Money (And Growing Like Crazy)
- 52-Week High / Low₹6,261 / ₹3,644
- Q3 FY26 Revenue₹5,345 Cr
- Q3 FY26 PAT₹510 Cr
- Q3 FY26 EPS₹14.42
- Annualised EPS (Q3×4)₹57.68
- Book Value₹172
- Price to Book21.7x
- Dividend Yield0.13%
- Debt / Equity0.38x
- Store Count1,164 stores
How a Tata Group Retail Company Became Wall Street’s Wet Dream
Let’s talk about Trent. Not the river, the company. Founded in 1998, took 16 years to go public, and then just decided it would become India’s most premium-valued fashion retailer while also operating budget fashion stores, hypermarkets, and whatever else fits the ‘retail’ umbrella.
The playbook is simple: Westside for the premium crowd. Zudio for everyone else. Star for groceries. A few boutique formats like Utsa and Samoh for the premium ethnic wear crowd. And partnerships with global brands like Zara and Massimo Dutti because why settle for one market segment when you can have them all.
Part of the Tata Group (37% promoter stake via Tata Sons and TIC). Strong governance. Stable outlook from CARE Ratings (AA+ on long-term facilities). A management team that reports financial results like an auditor on a sugar rush — precise, detailed, and occasionally self-aware about the absurdity of their growth metrics.
The company added 295 stores in FY25. Already at 1,164 in Q3 FY26. Over 75% of new Zudio stores in FY25 went to Tier II and III cities. The revenue runway? Potentially infinite. The valuation? Potentially infinite too. And that’s the tension this analysis tries to unpack.
Westside, Zudio, Star, Massimo Dutti, Zara, and Your Weekly Groceries Walk Into a Retail Store.
Trent doesn’t operate one retail model. It operates six. Think of it as a venture capital firm that decided to become a fashion company instead.
Westside: Premium apparel, lifestyle, and home furnishings. 278 stores across 93 cities. Targets the ‘I-have-money-and-taste’ segment. Sales per sq ft at ₹16,378 in FY25. Think of it as India’s answer to Nordstrom, if Nordstrom was run by engineers and accountants (because, Tata Group).
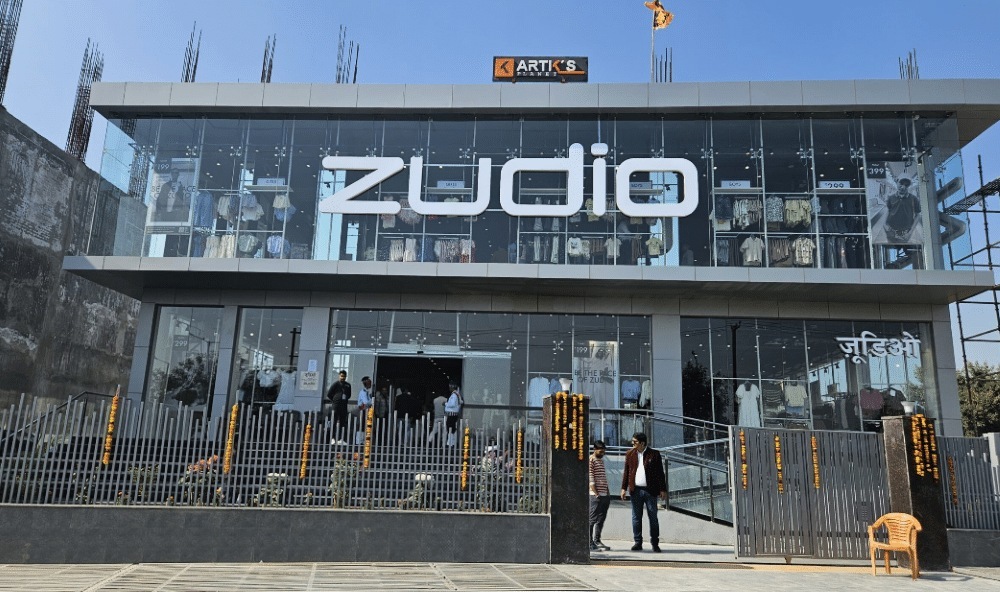
Zudio: Value fashion retail. 854 stores (including 4 in UAE) across 265 cities. The workhorse. Added 220 stores in FY25 alone. During 9MFY26, over 75% of new Zudio stores opened in Tier II, III cities and smaller markets. This is where Trent is essentially betting that fashion consumption in India’s non-metro cities will grow the way it grew in metros 10 years ago. Probably right. Definitely priced correctly. Maybe.
Star Hypermarket: Grocery and daily-use products. 79 stores (including sub-format store-in-store). 74% revenue from own branded products (Smartle and others). Think of it as a JV with Tesco that’s learning to walk without external support, slowly.
Boutique Formats: Utsa (ethnic wear), Samoh (premium occasions wear), Burnt Toast (premium casual), and online presence through Westside.com, Tata CliQ, and Tata Neu. These contribute to under 5% of revenues but signal ambition across every conceivable segment.
JV/Associate Portfolio: Inditex (Zara, Massimo Dutti), THPL with Tesco (Star operations). Trent holds stakes and distributes profitably but doesn’t bear full inventory/operational risk.
Q3 FY26: The Numbers That Make Your P/E Look Reasonable (Spoiler: It Doesn’t)
Result type: Quarterly Results (Q3 = Oct–Dec) | Q3 FY26 EPS: ₹14.42 | Annualised EPS (Q3×4): ₹57.68 | FY25 Full-Year EPS: ₹43.51
| Metric (₹ Cr) | Q3 FY26 Dec 2025 | Q3 FY25 Dec 2024 | Q2 FY26 Sep 2025 | YoY % | QoQ % |
|---|---|---|---|---|---|
| Revenue | 5,345 | 4,657 | 4,818 | +14.8% | +10.9% |
| Operating EBIT | 1,081 | 847 | 816 | +27.6% | +32.4% |
| OPM % | 20.2% | 18.2% | 16.9% | +200 bps | +330 bps |
| PAT | 510 | 497 | 373 | +2.6% | +36.7% |
| EPS (₹) | 14.42 | 13.99 | 10.60 | +3.1% | +36.0% |
P/E at 79.9x. We Need to Talk.
Method 1: P/E Based
Annualised EPS (Q3×4) = ₹57.68. Current CMP = ₹3,723. P/E = 3,723 ÷ 57.68 = 64.5x. But FY25 full-year EPS was ₹43.51. Using that: P/E = 3,723 ÷ 43.51 = 85.5x. Nifty 50 median P/E = 24x. Trent is trading at 2.5x–3.5x the market multiple. For a company growing revenue at 38% and EBIT margins expanding, the question is: How many years of growth are baked in?
Range: ₹2,200 – ₹4,100
Method 2: EV/EBITDA Based
FY25 EBITDA (Operating EBITDA ex-IND AS 116 impact) ~₹2,700 Cr. Current EV = ₹1,34,494 Cr. EV/EBITDA = 49.8x. For comparison, high-growth retail in US/EU trades at 15x–25x. This is a stretched multiple by any global benchmark. However, factoring in Trent’s growth and market expansion in India, adjusted range: 20x–35x EBITDA.
EV range (20x–35x): ₹54,000 Cr – ₹94,500 Cr → Per share:
Range: ₹1,515 – ₹2,652
Method 3: DCF Based
Base FCF: ~₹1,661 Cr (FY25 operating CF). Growth assumption: 18% for 5 years (below historical 38%, accounting for base effects). Terminal growth: 6%. WACC: 12%.
→ Terminal Value (6% growth / 6% cap rate): ~₹60,000 Cr
→ Total EV: ~₹69,200 Cr (near-zero net debt, cash-rich)
Range: ₹1,650 – ₹2,850
Zudio’s Expansion is Outpacing Reasonable Projections (And Nobody’s Complaining)
🔥 The Big One: 1,164 Stores. 274 Cities. And Still Expanding Like There’s No Tomorrow.
Q3 FY26: Trent opened 17 Westside + 48 Zudio stores in a single quarter. FY25: 295 new stores (net). The expansion isn’t haphazard — 75% of Zudio stores in 9MFY26 went to Tier II/III cities. This is a deliberate strategy to capture markets before they get captured. Management’s comment: “newer markets will mature over a two-to-three year period.” Translation: We’re planting seeds. Some will become trees. Most will survive.
✅ Fashion Growth Continues
- • Like-for-like sales growth in 9MFY26 in low single digits (Q3 was marginally negative due to early festive season shift)
- • 21% of revenues from emerging categories (beauty, innerwear, footwear)
- • Westside online grew 38% YoY in Q3, contributing 6% of Westside revenues
- • Own brands (Nuon, Studiofit, WES, etc.) driving higher margins at Westside
⚠️ Execution Risks to Track
- • Store profitability maturity curve: Newer stores take 2–3 years to reach productivity
- • Fashion trend sensitivity: Discretionary retail is vulnerable to economic slowdowns
- • Inventory management: Outright purchase model (not sale-or-return) ties up working capital
- • Competitive intensity: Shoppers Stop, Lifestyle International, online players (Amazon, Flipkart) are not asleep
Is the Fort Strong? Let’s See What the Vault Looks Like.
| Item (₹ Cr) | FY24 | FY25 (Mar 2025) | Q2 FY26 (Sep 2025) | Latest (9M FY26) |
|---|---|---|---|---|
| Total Assets | 7,162 | 9,420 | 10,735 | 10,735 |
| Net Worth (Equity + Reserves) | 4,068 | 5,462 | 6,102 | 6,102 |
| Borrowings | 1,753 | 2,237 | 2,349 | 2,349 |
| Other Liabilities | 1,341 | 1,721 | 2,284 | 2,284 |
| Total Liabilities | 7,162 | 9,420 | 10,735 | 10,735 |
Where Money Actually Goes (Spoiler: Mostly into New Stores)
| Cash Flow (₹ Cr) | FY24 | FY25 | 9MFY26 (estimate) |
|---|---|---|---|
| Operating CF | +1,349 | +1,661 | +1,350* |
| Investing CF | -508 | -923 | -650* |
| Financing CF | -629 | -694 | -550* |
| Net Cash Flow | +211 | +44 | +150* |
These Are Not Your Grandpa’s Retail Metrics
Growth At Every Line Item (Except Humility)
| Metric (₹ Cr) | FY23 | FY24 | FY25 | TTM (Latest) |
|---|---|---|---|---|
| Revenue | 8,242 | 12,375 | 17,118 | 19,263 |
| Operating EBIT | 1,114 | 1,971 | 2,820 | 3,396 |
| OPM % | 13.5% | 15.9% | 16.5% | 17.6% |
| PAT | 394 | 1,477 | 1,534 | 1,657 |
| EPS (₹) | 12.51 | 41.82 | 43.51 | 46.10 |
Revenue growing at 38% YoY (FY25) while profit margins expand simultaneously. This is not typical retail. Typical retail trades revenue growth for margin compression (due to competitive pressure). Trent is doing the opposite. Explain that.
Trent vs. The Retail Gang (And Why Trent Is the Overachiever)
| Company | Q3 Revenue (₹ Cr) | Q3 PAT (₹ Cr) | P/E | ROCE % |
|---|---|---|---|---|
| Trent Ltd | 5,345 | 510 | 79.9x | 30.7% |
| Lenskart Solut. | 2,308 | 133 | 238.4x | 5.6% |
| AB Lifestyle | 2,343 | 100 | 70.5x | Negative ROIC |
| Vedant Fashions | 492 | 135 | 24.6x | 25.9% |
| V2 Retail | 929 | 82 | 54.4x | 16.9% |
Trent’s P/E looks high until you compare the profitability. Q3 PAT margin: 9.5%. Vedant’s: 27.4%. But Vedant is 2% of Trent’s market cap and 9% of its revenue. Scale matters. Trent is the only player scaling to ₹5,000+ Cr quarterly revenue while maintaining high margins and ROCE. Lenskart trades at 3x Trent’s P/E but has zero ROCE. Make of that what you will.
The Tata Group’s Prized Retail Child
- Promoters (Tata Sons 32.45%, TIC 4.28%)37.01%
- Public / HNIs25.87%
- DIIs (Mutual Funds, Insurance)21.37%
- FIIs15.62%
Pledge: 0.00%. Shareholding stable. No promoter selling. 5.07 lakh shareholders — up from 3.46 lakh in Sep 2024. Retail participation growing.
Promoter: Tata Sons / TIC
Part of the Tata Group since 1998. Stable ownership. No founder dramatics. CARE Ratings explicitly factors in “strong managerial and financial support from TSPL.” This is code for: the Tata Group will fund Trent’s expansion without hesitation. FY20 example: TSPL injected ₹950 crore for capex and backend investments.
Management: Noel N. Tata, Chairman
Nephew of Ratan Tata. Runs Trent and hotel companies. By all accounts, a disciplined operator. Earnings calls are detailed, transparent, and occasionally self-aware about valuation. This is not a CEO hyping the stock. This is a CEO executing and letting the numbers speak.
If Governance Were a Neighbourhood, Trent Would Be That House With Perfect Landscaping
✅ Governance Strengths
- ✓ Clean audit history — no material qualifications
- ✓ CARE Ratings: AA+ on long-term facilities
- ✓ Quarterly concalls with management Q&A
- ✓ Promoter pledge: 0% — skin in the game
- ✓ Interest coverage: 20x+ — debt is trivial
- ✓ ESG initiatives: B- rating in CDP climate evaluation
⚠️ Watch List
- ⚠ P/E at 79.9x — valuation already reflects perfection
- ⚠ Inventory obsolescence risk — outright purchase model
- ⚠ Retail-specific economic sensitivity — discretionary spending
- ⚠ Subsidiaries (Booker, Fiora) — mixed profitability
- ⚠ Store maturity curve — 2–3 years to profitability
- ⚠ Seasonal business — Q3 revenue mix affected by early festive season
Fashion Retail in India: A Market That’s Bigger Than You Think But Still Small Enough to Get Excited
India’s apparel and fashion market is estimated at ~₹1.5 lakh crore annually. Trent’s ₹19,263 Cr (TTM) = 1.3% of the market. So while Trent looks like a dominant player, it’s still a minority share. The market is growing at 10–12% CAGR. Trent is growing at 38%. This means market share consolidation is happening, and Trent is the consolidator.
🏙️ Tier II/III Opportunity: The Real Tailwind
Westside and Zudio are planting flags in India’s second and third-tier cities now. These cities are 5–10 years behind metros in fashion adoption. But they’re growing faster. Trent’s bet: Get there early, build brand preference, and own the market as incomes rise. This is working. Over 75% of new Zudio stores in 9MFY26 went to Tier II/III. This is not yet fully reflected in same-store sales (because new stores take 2–3 years to mature), but it’s the future revenue pool.
⚡ E-commerce Reality: Westside Online is Profitable
38% growth YoY in Westside online (Q3 FY26). 6% of Westside revenues from online. This is profitable online growth — not loss-making marketplace play. The omnichannel model (stores + Tata CliQ + Tata Neu + Westside.com) is working. Amazon and Flipkart pose competitive threat but Trent’s integrated model gives it pricing power and margin protection.
⚠️ The Competitive Pressure: Not Gone, Just Sleeping
Shoppers Stop, Lifestyle International, Aditya Birla Fashion are old rivals. But Trent’s 51% market share in branded retail gives it pricing power. Unbranded players (small boutiques, street markets) take 75%+ of the market but are fragmented and can’t compete on scale. The real threat: Economic slowdown kills discretionary spending. That’s cyclical, not structural.
🧠 Macro Tailwind: India’s Rising Consumer Spending
India’s per capita spending on apparel is still ₹1,200–₹1,500 per year (vs. US at ₹10,000+). Room to grow. Rising incomes, urbanisation, and mall/retail space addition are happening. GST stabilisation (post-rate revision in 2024) should help. Trent’s timing on Tier II/III expansion aligns with this macro cycle. Tailwind is real.
The Fashion Retail Paradox
Trent is executing almost flawlessly. Revenue growth at 38%. Margin expansion of 200+ bps. ROCE at 30.7%. Store count growing 25%+ annually. Online growing 38%. Market share consolidating. But it’s priced like it will execute flawlessly for the next 10 years without a single hiccup. The P/E of 79.9x is not betting on perfection. It’s betting on perfection at a discount.
The Bull Case: Trent is early-to-mid innings of a massive opportunity. Tier II/III cities will unlock 10+ years of 15%+ revenue growth. Margins are expanding, not compressing. ROCE is world-class. Cash flow is strong and self-funding expansion. Tata Group backing = no financing risk. The stock could easily be at ₹7,000–₹8,000 in 5 years if Trent executes and the market reprices to 30x–40x earnings (normalized for lower growth). That’s a 2x or better return.
The Bear Case: At 79.9x P/E, all growth is already priced in. Any disappointment (same-store sales slowdown, margin compression, economic slowdown) will trigger a 30–40% correction. Fashion is trend-driven and vulnerable to economic cycles. Store profitability takes 2–3 years to materialize — meanwhile, Trent is burning capex. Inventory obsolescence risk (outright purchase model). Competitive intensity from online and unbranded players. If growth slows to 12–15% (still excellent), the P/E multiple will compress to 40x–50x, wiping out gains.
The Reality: Trent is a genuine business with genuine execution. But it’s also a momentum stock riding a wave of Indian consumption tailwinds and fashion retail consolidation. The company is worth ₹1,650–₹4,100 per share depending on growth assumptions. At ₹3,723, the margin of safety is thin. You’re paying for most of the good news already. If Trent is your conviction, dollar-cost average. Don’t go all-in at 79.9x P/E unless you have a 5–7 year investment horizon and can stomach 40%+ volatility.
✓ Strengths
- ₹1,164 stores across 274 cities; 15.8M sq ft retail area
- 30.7% ROCE; 20.2% OPM; expanding margins
- 38% revenue growth YoY; strong same-store sales in 9MFY26
- Omnichannel execution (Westside online +38% growth)
- Tata Group backing; zero promoter pledge; fortress balance sheet
- Market consolidation play in fragmented retail
✗ Weaknesses
- P/E at 79.9x — already pricing in significant growth
- Inventory model risk — outright purchase vs. sale-or-return
- Store maturity curve — 2–3 years to profitability
- Booker India and subsidiary profitability mixed
- Seasonal business — early festive seasons distort comparisons
- High capex requirements for continued expansion
→ Opportunities
- Tier II/III city penetration — 5–10 year runway of growth
- E-commerce profitability — Westside online model scalable
- Emerging categories — beauty, innerwear, footwear at 21% of revenues
- Market consolidation — unbranded retail fragmentation
- Brand loyalty across geographies — Westside, Zudio moats
- Partnerships (Zara, Massimo Dutti) — premium segment access
⚡ Threats
- Economic slowdown — discretionary spending vulnerability
- Fashion trend changes — style obsolescence risk
- Competitive intensity — Shoppers Stop, Lifestyle, online
- E-commerce disruption — Amazon, Flipkart, Myntra
- Real estate inflation — rising store rental costs
- Inventory management — wrong product mix = markdowns
Trent is a genuinely excellent company in a genuinely growing market, at a valuation that leaves very little room for disappointment.
The question isn’t whether Trent will succeed. It probably will. The question is whether it will succeed enough to justify an 80x P/E. That requires sustained 15%+ growth, margin stability, and no economic hiccups for the next 5+ years. Plausible? Yes. Guaranteed? Absolutely not. Fair value range suggests ₹1,650–₹4,100 depending on growth rates. At ₹3,723, you’re paying for the good news to continue. It might. Or you might get a more attractive entry point on any correction. The choice is yours. We’re just here to ensure you make it with open eyes.