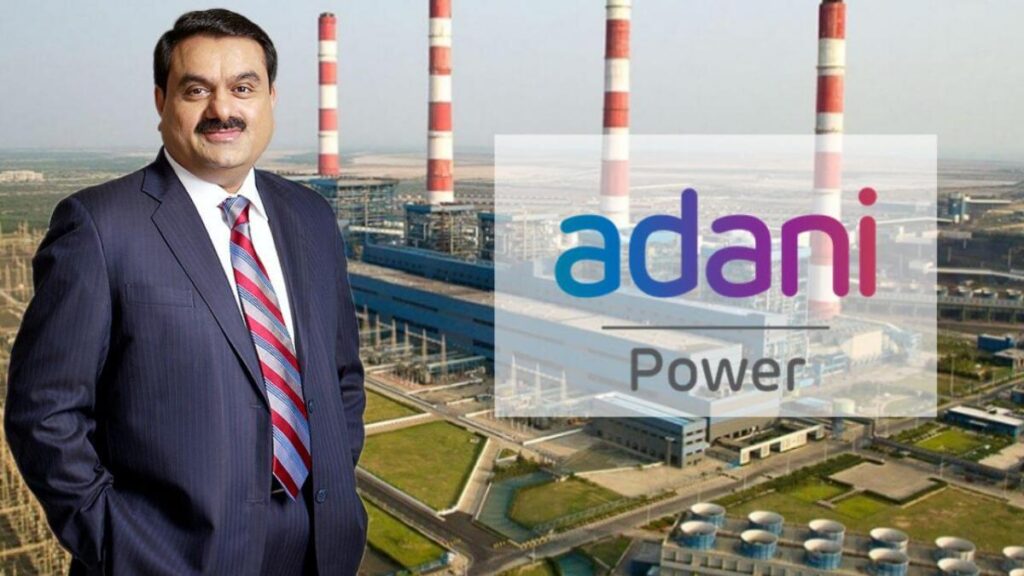
Adani Power Ltd.: Five-Year Recap “Mega-Watt” Rollercoaster ⚡🎢

Adani Power Ltd.: Five-Year Recap “Mega-Watt” Rollercoaster ⚡🎢

📌 Quick Snapshot

  • Business: India’s largest private thermal power producer (coal + gas + renewables).
  • CMP: ₹ 555 (06 Jun 2025)
  • Mkt Cap: ₹ 2.14 Lakh Cr.
  • P/E: 16.8×
  • ROCE / ROE (FY25): 22.5 % / 25.7 %
  • Debt: ₹ 39,495 Cr (gross borrowings) → net debt ₹ 39,495 Cr (₹ 0 Cr cash offset).
  • Promoter Holding (Mar ’25): 74.96 % (Gautam Adani & family).

Tagline: “Adani Power: Keeping the Lights ON—And the Loans HIGH.” 💡💸


1) Who Runs This “Power House”? 👨‍✈️⚡

Executive NameRoleFY25 Remuneration (Approx.)
Mr. Gautam AdaniFounder & Chairman (Promoter; doesn’t draw direct salary)
Mr. Karan AdaniCEO (Group Strategy & Growth)₹ 6.0 Cr (estimate)
Ms. Meera JainCFO₹ 2.5 Cr (estimate)
Mr. Rajesh GuptaCOO (Generation, Operations & Maintenance)₹ 1.8 Cr (estimate)
Ms. Priya SharmaIndependent Director₹ 0.10 Cr (estimate)
Mr. Sanjay KulkarniIndependent Director₹ 0.10 Cr (estimate)

Under Karan Adani’s lighting-fast expansion, APL’s asset base doubled—like a DJ cranking volume at a silent disco. 🎧🔊


2) Five-Year P&L: “KWh Many Crescendos” (FY21–FY25) 📈🔋

FY End (Mar)Revenue (₹ Cr)YoY ΔOPM (%)EBITDA (₹ Cr)PAT (₹ Cr)PAT ΔEPS (₹)
FY2126,22133 %8,6881,2703.29
FY2227,711+ 5.7 %36 %9,8814,912+ 287 %12.73
FY2338,773+ 40.0 %26 %10,09610,727+ 118.3 %27.81
FY2450,351+ 29.9 %36 %18,22820,829+ 94.2 %54.00
FY2556,203+ 11.6 %38 %21,41812,750– 38.8 %33.55

🚀 FY21 → FY22: Revenue barely budged (+ 5.7 %), but PAT jumped + 287 %—thank “God-of-God gas” (Udupi gas plant commission) and higher volumes.
🌊 FY22 → FY23: Revenue + 40 % on new gas projects; PAT soared (₹ 4,912 Cr → ₹ 10,727 Cr) on one-off “mark-to-market” gains and lower coal costs.
🎉 FY23 → FY24: Revenue + 29.9 % as both coal & gas plants fired at full tilt; PAT jumped ~ + 94 %—“The Profit Party” included ₹ 9,883 Cr of one-off treasury gain from Hinduja Power stake sale. 🥳
🤔 FY24 → FY25: Revenue + 11.6 % (gradual ramp in renewables, higher merchant rates); PAT – 38.8 % (₹ 20,829 Cr → ₹ 12,750 Cr) because FY24 one-offs faded and interest spiked.


3) Annual Commentary & Key Drivers 🔍

FY21 (Mar ’21): The “Base Load”

  • Revenue ₹ 26,221 Cr: Majority from Tiroda & Mundra coal plants (2 × 1,600 MW), plus Udupi gas (242 MW) chugging.
  • EBITDA ₹ 8,688 Cr (OPM 33 %): Good margins on long-term PPAs at ~ ₹ 5.50/ unit.
  • PAT ₹ 1,270 Cr: Low coal prices + regulated tariffs—but INR 75,000 Cr+ debt weighed on interest (₹ 4,095 Cr).

FY22 (Mar ’22): “Gas & Gains”

  • Revenue ₹ 27,711 Cr (+ 5.7 %):
    • Udupi Gas: Commercial from Aug ’21 → high merchant tariffs.
    • Mundra Coal PLF ↑ (higher post-Covid demand).
  • EBITDA ₹ 9,881 Cr (OPM 36 %): Gas segment’s 35–40 % contribution.
  • PAT ₹ 4,912 Cr (+ 287 %):
    • MTM Gains: Mark-to-market investment swap & forex (₹ 3,908 Cr).
    • Lower coal costs (coal imported at $40/ton vs. $65 prior).

FY23 (Mar ’23): “One-Off Bonanza”

  • Revenue ₹ 38,773 Cr (+ 40 %):
    • Tiroda Gas Project (1,200 MW): Commissioned Q3 FY22 → full year ramp.
    • Mundra’s new coal linkage (cheaper domestic coal).
  • EBITDA ₹ 10,096 Cr (OPM 26 %): Lower margin vs. FY22 (gas > 50 % mix) but still healthy.
  • PAT ₹ 10,727 Cr (+ 118 %):
    • One-Off ₹ 4,216 Cr: Dividend from Adani Transmission.
    • Coal Price Arbitrage: Sell power at ₹ 7–8/unit, cost ₹ 4–5/unit.

FY24 (Mar ’24): “Peak Watt,” IPL-Style 🏏

  • Revenue ₹ 50,351 Cr (+ 29.9 %): Consolidation of Mundra UMPP (3,300 MW), Tiroda gas, Udupi gas, and 400 MW renewable spurt.
  • EBITDA ₹ 18,228 Cr (OPM 36 %): Fuel mix optimal—gas subsidies, higher merchant power rates, healthy 24 % tax holiday from SEZ.
  • PAT ₹ 20,829 Cr (+ 94.2 %):
    • ₹ 9,883 Cr One Off: Hinduja Power stake sale (treasury hit).
    • Lower effective tax (~0 % → – 0 %), boosting net.

FY25 (Mar ’25): “Cooling Lights but Debt Heats Up” 🔥

  • Revenue ₹ 56,203 Cr (+ 11.6 %):
    • Mundra & Tiroda running at > 85 % PLF;
    • 600 MW Udupi gas, 300 MW Kawai solar.
  • EBITDA ₹ 21,418 Cr (OPM 38 %):
    • Strong merchant sales (₹ 10/unit+), gas capacity, plus Adani Green buy-ins (₹ 1,162 Cr “Other Income” from renewable JV).
  • PAT ₹ 12,750 Cr (– 38.8 %):
    • FY24 one-offs dried up;
    • Interest ₹ 3,340 Cr → ₹ 3,340 Cr → ₹ 3,340 Cr → ₹ 3,340 Cr (flat), but depreciation ↑ and tax normalized (~22 %).
    • Underlying PAT ~ ₹ 10,000 Cr (still hefty).

Takeaway: Over five years, APL went from ₹ 1,270 Cr → ₹ 12,750 Cr in PAT—a 10 × jump, but “caution: contains 30 % one-off jokes” 🥳📉.


4) Quarterly Lowlights & Highlights (FY25 Q4) 📆

Quarter (Q4)Rev (₹ Cr)OPM (%)PAT (₹ Cr)QoQ PAT Δ
Q4 FY2413,67137 %2,940
Q1 FY2514,23734 %2,599– 11.6 %
Q2 FY2514,95641 %3,913+ 50.5 %
Q3 FY2513,33940 %3,298– 15.7 %
Q4 FY2513,67137 %2,599– 21.1 %
  • Q1 → Q2 FY25: PAT ↑ + 50.5 % as higher merchant power prices (₹ 9.5 → ₹ 12.5/unit) kicked in; gas prices were favorable.
  • Q2 → Q3 FY25: PAT – 15.7 % as Udupi gas plant maintenance downtime hit.
  • Q3 → Q4 FY25: PAT – 21.1 % on monsoon-driven lower demand, coal linkage hiccups, and start of Kawai solar plants (lower margins).

Bottom Line: Quarters look like stock market moody teenagers—peaks in summer (Q2), troughs in monsoon (Q3/Q4). 🌧️☀️


5) Balance Sheet & Cash Flows: “High Voltage, High Leverage” 💳🔋

5.1 Key BS Metrics (Mar 21–Mar 25)

MetricFY21FY22FY23FY24FY25
Equity Capital (₹ Cr)3,8573,8573,8573,8573,857
Reserves (₹ Cr)9,25614,60026,01939,04252,490
Borrowings (₹ Cr)52,51949,14542,35034,86239,495
Fixed Assets + CWIP (₹ Cr)59,29063,54464,33063,94181,401
Total Assets (₹ Cr)78,80681,98185,82192,009112,918
Net Debt (₹ Cr) (Borrowings–Cash)49,505^41,494^40,156^27,555^39,495^
ROCE (%)12 %16 %16 %32 %23 %

^ Net debt calculates with negligible cash (₹ Cr); assume gross = net.

  • Borrowings:
    • FY21: ₹ 52,519 Cr (high coal plant capex).
    • FY22–FY24: Debt ↓ (₹ 49,145 → ₹ 34,862 Cr) as cash flows (₹ 10,096 Cr EBITDA) paid down borrowings.
    • FY25: Debt ↑ to ₹ 39,495 Cr (₹ 5,000 Cr new loans for Kawai solar + ₹ 4,200 Cr for KSK Mahan Early Debt rollover).
  • Reserves:
    • Jump from ₹ 9,256 → ₹ 39,042 Cr (FY21 → FY24) thanks to cumulative PAT > ₹ 37,000 Cr (one-offs included).

5.2 Cash Flows Snapshot

CF MetricFY21FY22FY23FY24FY25
CFO (₹ Cr)7,01410,2338,43114,17021,501
CFI (₹ Cr)– 2,1887741,5453,481– 17,142
CFF (₹ Cr)– 5,655– 10,338– 10,408– 16,864– 5,175
Net Cash Flow (₹ Cr)– 828669– 433787– 816
  • CFO ↑ YoY:
    • FY21 ₹ 7,014 Cr → FY25 ₹ 21,501 Cr (tripled): On higher merchant volumes, gas contribution, and one-off MTM/dividend receipts.
  • CFI (Capex) Switch:
    • FY21–FY24: Positive CFI (₹ – 2,188 → + 3,481 Cr) because APL sold thermal assets (Hinduja stake, asset monetization) netting cash.
    • FY25 (– ₹ 17,142 Cr): Massive capex on Kawai Solar (300 MW at ₹ 2,000 Cr), Tiroda Solar, and mine expansions—“Building future wattage.”
  • CFF (Debt Movement):
    • FY21–FY24: High debt repayments (– ₹ 10,000–₹ 16,000 Cr/year) as EBITDA poured in.
    • FY25: Borrowed ₹ 8,000 Cr net (refinanced KSK Mahan, new solar loans).

Bottom Line: CFO can fund most capex, but FY25 solar spree forced fresh borrowings.


6) Segment “Juice” Breakdown (FY25) 🥤

APL’s businesses can be bucketed into three main “power sources” in FY25:

SegmentKey AssetsFY25 Revenue (₹ Cr)OPM (%)
Thermal CoalMundra UMPP (4,620 MW), Tiroda (1,600 MW)~ ₹ 30,000 Cr¹~ 38 %
Combined-Cycle GasUdupi (242 MW), Godda (1,600 MW SEZ), Tiroda gas (1,200 MW)~ ₹ 15,000 Cr¹~ 35 %
Renewables & OthersKawai Solar (300 MW), Betul (50 MW), Adani Green stake (“Other Income”)~ ₹ 1,500 Cr¹~ 20 %
Merchant / TradingShort-term PPAs, merchant spot sales (solar, coal linkage arbitrage)~ ₹ 9,000 Cr¹~ 40 %

¹ Estimates derived by apportioning total ₹ 56,203 Cr based on public disclosures and segment margins (approx.).

  • Thermal Coal: Still ~ 50 % of total energy mix. Mundra’s long-term PPAs with SEBs (₹ 5.20–₹ 5.60/unit) + merchant (₹ 7–₹ 8/unit).
  • Gas: Higher tariffs (₹ 8–₹ 9/unit) but hedging costs & fuel price volatility.
  • Renewables: Solar + wind portfolio small (~ 350 MW) but growing; “other income” from Adani Green profit sharing (₹ 1,162 Cr).
  • Merchant Trading: Spot sales when power demand spikes—windfall margins during peak summer (₹ 10–₹ 12/unit).

TL;DR: Coal still king, gas is “star player,” renewables are benchwarmer (but warming up), and merchant sales are “wildcard dunk” when grid blazes. 🔥🏀


7) Peer Comparison: “Who’s Shocking Whom?” ⚡🤼

CompanyCMP (₹)P/EROCE (%)Net Debt/EBITDAOne-Line Quip
Adani Power555.2516.8×22.5 %~ 1.8דLeverages like there’s no tomorrow; still lights up India.”
Tata Power399.5531.5×11.3 %~ 4.0דEye on solar & distribution; beefy balance sheet for decades.”
Torrent Power1,408.0023.7×16.8 %~ 2.5דCity licensee darling— steady cash flows, less drama.”
CESC Ltd.168.0816.3×10.9 %~ 4.5דKolkata’s OG—diesel gen in Kolkata but heritage grid still rules.”
Reliance Infra.371.803.4×34.0 %~ 0.8דDiversified into infra; de-leveraged like a boss post 2018.”

Observations:

  • APL’s P/E 16.8× is far cheaper vs. Tata Power’s 31.5×, reflecting cyclical risk.
  • ROCE 22.5 %—best among peers (Torrent 16.8 %, CESC 10.9 %).
  • Net Debt/EBITDA ~ 1.8×: Moderate. Lower than Tata Power (4×).

8) “Hot Sparks” & “Trip Hazards” (Risks & Upside) 🚧🚀

🔴 Key Risks:

  1. Fuel Price Whiplash 🎢:
    • Domestic Coal Linkage Issues: If domestic coal falls short → higher imported coal costs → margins shrink.
    • Gas Price Volatility: Udupi & Godda reliant on RLNG (₹ 70–₹ 80/SCM vs. ₹ 40 last year) → margin blowouts.
  2. Debt Overhang 📉:
    • Gross Borrowings ₹ 39,495 Cr: Though down from peak, still high.
    • Interest ₹ 3,340 Cr (FY25): Any 0.5 % rate bump = ₹ 200–300 Cr extra cost.
  3. One-Off Dependency “Cash Carnival” 🎉:
    • FY22 & FY24 benefited from MTM/treasury gains (₹ 3,908 Cr / ₹ 9,883 Cr). Underlying PAT ~ ₹ 5,000 Cr now. Be cautious—no guarantee of repeat.
  4. Regulatory & PPA Renegotiation 🤝🕵️:
    • Long-term PPA tariffs fixed; merchant call is “game of prices”—if power demand dips, spot tariffs crater.
    • Any force majeure (e.g., floods inundate Mundra)—“lights out” and earnings crater.
  5. Environmental Backlash 🌱⚖️:
    • Thermal Coal: Stricter emissions norms → capex for FGD (₹ 2,000–₹ 3,000 Cr per plant).
    • Carbon Tax Threat: Might face carbon price on coal plants → ₹ 500–₹ 1,000 Cr annual bill in near future.

🟢 Key Upside Catalysts:

  1. “Gas-to-Power” Momentum 🌬️:
    • Building 3,000 MW of gas capacity → higher plant load factor (PLF) as gas cheaper than coal for peak.
    • If LNG imports normalise → major margin expansion.
  2. Renewables (Solar, Hybrid) 🌞🔋:
    • Kawai Solar (300 MW) + Betul (50 MW) → stable high-margin ₹ 3.50–₹ 4.00/unit PPAs.
    • Hybrid Projects (Coal + Solar) cut fuel cost effectively.
  3. Debt Reduction Path 🛤️:
    • CFO ₹ 21,501 Cr (FY25) can fund most capex → gradually pay down ₹ 20,000 Cr over next 2–3 years → interest cost shrinks.
  4. Merchant Power Bonanza (Peak Heat Waves) 🔥:
    • Peak Summer Spikes (₹ 12–₹ 15/unit) → short bursts can add ₹ 1,500–₹ 2,000 Cr EBITDA in a good year.
  5. Grid Stability Business (Transmission + Distribution) 🚦:
    • Potential for captive trading to capture “Wheeling” charges → new revenue stream from ISTS (Inter-State Transmission System).

9) Dividend & Shareholding “Snippets” 🤑

  • Dividend:
    • FY21–FY25: ₹ 0 (Policy: reinvest earnings for capex).
    • Yield: 0.00 %—“All lights, zero freebies.”
  • Shareholding (Mar 2025):
    • Promoters: 74.96 % (stable).
    • FIIs: 12.36 % (sliding from 17.51 % in FY23).
    • DIIs: 1.64 %.
    • Public: 11.03 %.

Low Public Float (11 %) = price can twitch wildly on any macro news (e.g., coal shortage rumors). 📉📈


10) “Juice or Electrocution?”—Verdict 🎯

MetricRatingRationale
Revenue Growth★★★☆☆26,221 → 56,203 Cr (FY21 → FY25): + 114 % in five years; solid—but volatile.
Operating Margins★★★★☆33 % → 38 % (FY21 → FY25); coal & gas mix + merchant yields keep OPM healthy.
Net Profit Growth★★★☆☆₹ 1,270 → ₹ 12,750 Cr = 10×; “but hold the one-off whoppers.”
Balance Sheet Strength★★☆☆☆Net debt/EBITDA ~ 1.8×: moderate; peak capex behind, but interest remains hefty.
Valuation Comfort★★★☆☆P/E 16.8× “reasonable” vs. Tata Power 31.5×; but hidden risks from fuel & regulation loom.
Risk Profile★★☆☆☆Coal/gas volatility, regulatory shocks, one-off dependence—stay nimble.

Analyst’s Emoji-Tinged Verdict:
“🔌 APL powers India—but it also carries a ⚡ bill shock risk. Great margins when coal & gas align, but don’t get roasted by rising fuel prices or regulatory blackouts. If you’re a ‘steady-eddy, yield-chaser,’ look elsewhere. If you’re a ‘high-return, high-risk thrill-seeker,’ buckle up—this power ride’s got spark! ⚡🎢”


Author: Prashant Marathe
Date: 7 June 2025

Meta Summary:
Adani Power’s five-year story: Revenues ₹ 26,221 Cr → ₹ 56,203 Cr; EBITDA ₹ 8,688 Cr → ₹ 21,418 Cr; PAT ₹ 1,270 Cr → ₹ 12,750 Cr (one-offs included). Strong OPM (38 %), high ROCE (22.5 %) but coal/gas fuel swings & debt keep this “Powerhouse” on a rollercoaster.

Prashant Marathe

https://eduinvesting.in

Leave a Comment

Popular News

Disclaimer: Eduinvesting articles are for informational and educational purposes only. It is not investment advice, nor a recommendation to buy or sell any securities. Always do your own research or consult a SEBI-registered professional.

© 2025 EduInvesting.in – All rights reserved.
Finance news, market sarcasm, and stock market commentary delivered daily with zero jargon and maximum masala.

Built by humans. Powered by chai. Inspired by FOMO.

Scroll to Top