₹188 crore market cap. Stock price around ₹130. One-year return looks like it slipped on turmeric powder (-39.9%), while the latest quarter looks like it drank energy drink with extra masala. Q3 FY26 revenue came in at ₹92.35 crore, up a spicy 45.6% YoY, and PAT jumped to ₹5.55 crore, growing a shocking 141% YoY. Operating margin hovered around 10.7%—not Michelin-star level, but respectable for a mass-market spice grinder. P/E sits at 9.95x versus an industry median flirting near mid-20s. Debt-to-equity is 0.74, not zero, not scary, just… present. Promoters hold 68.1%, with no pledging drama.
In short: the numbers scream “regional FMCG rocket just lit,” while the stock chart still sulks in a corner thinking about its life choices. Curious already? Good. Keep reading, because this masala packet has more layers than your mom’s biryani.
2. Introduction – From Kitchen Shelf to Stock Market Masala
Madhusudan Masala Ltd was incorporated in 1982, which means this company was grinding spices when Harshad Mehta was still learning stock basics. For decades, it lived a simple, honest life—selling masalas, building trust in western India, and not bothering Dalal Street too much. Then came the SME listing era, expansion dreams, branded ambitions, and suddenly this humble spice maker decided, “Bhai, ab pan-India khelenge.”
Today, MML sits at an interesting junction. On one hand, it’s still very much a regional king—~35% market share in Saurashtra is no joke. On the other, it dreams of capturing 1% of the entire branded Indian spice market in five years. That’s like a district-level batsman saying he wants to open for Team India. Ambitious? Yes. Impossible? Not necessarily—India eats a lot of masala.
But markets are cruel. They don’t care about childhood dreams or grandma’s secret garam masala recipe. They care about revenue, margins, cash flow, and whether management can walk the talk without slipping on coriander seeds. So let’s break this company down—politely, sarcastically, and with full auditor-level suspicion.
3. Business Model – WTF Do They Even Do?
At its core, Madhusudan Masala does one thing: turn agricultural produce into kitchen essentials. Simple? On paper, yes. In execution, it’s a daily wrestling match with commodity prices, distribution chaos, and Indian consumers who want “premium quality at sasta price.”
The company manufactures and processes 32+ types of products: Ground spices, blended spices, whole spices, tea, rajgira flour, papad, soya products, hing, achar masala, sanchar, rock salt powder, katlu powder, kasuri methi… basically if it goes into an Indian thali, MML wants a piece of it.
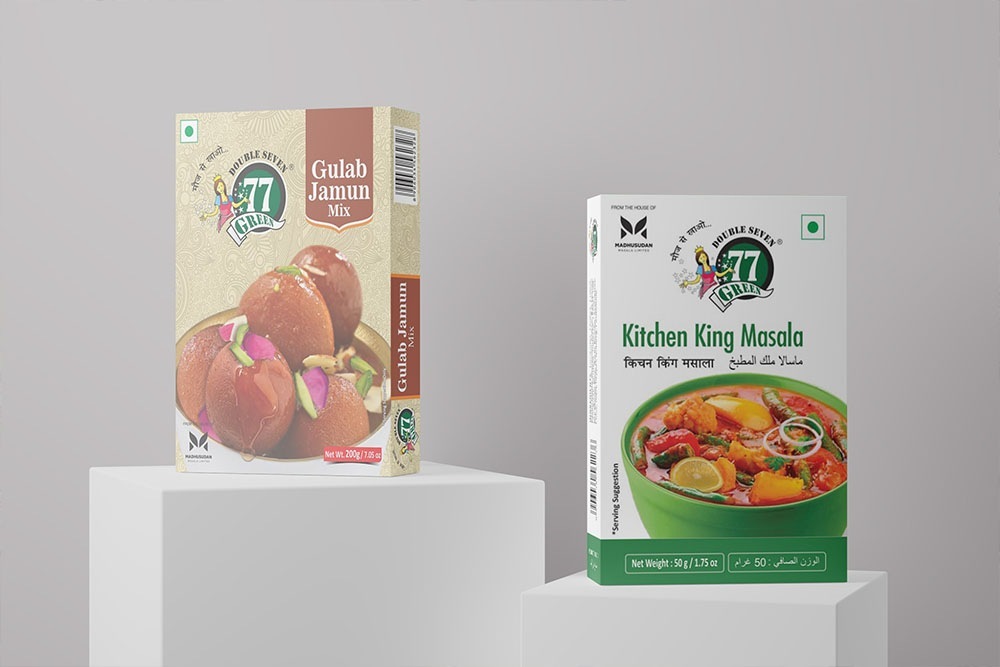
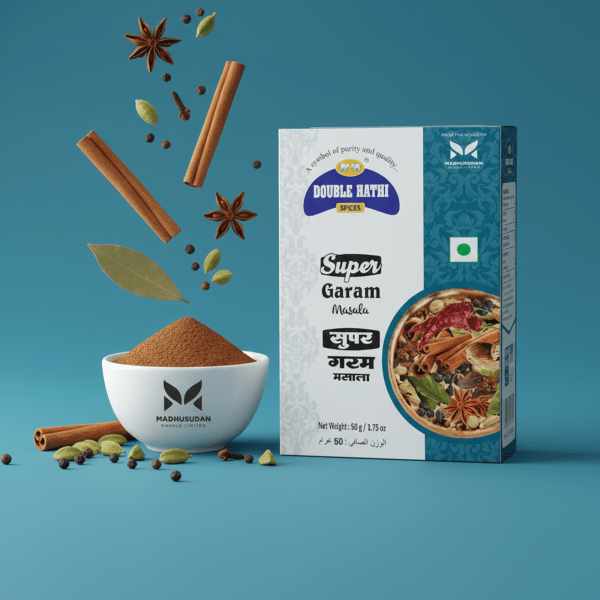
Brands? Four of them: Double Hathi, Maharaja Mantavya, 77 Green, and the unbranded bulk business that quietly pays the bills. Over 500 SKUs. Yes, five hundred. Somewhere, an SAP consultant is crying.
Distribution is old-school FMCG grind: 12,000+ retail stores, 200+ distributors, stronghold in Gujarat, Maharashtra, Goa, Telangana, and expansion tentacles into Punjab, UP, Bihar, Jharkhand, and J&K. This is not a “click-to-buy gourmet spice” startup. This is kirana-store capitalism.
Question for you: Can a regional FMCG player scale nationally without burning cash like camphor in aarti? Hold that thought.
4. Financials Overview – Numbers That Make You Raise an Eyebrow
Result Type Lock: This is Quarterly Results (Q3 FY26). EPS annualisation is locked accordingly.
Quarterly Comparison Table (₹ crore)
Metric
Latest Qtr (Dec 2025)
YoY Qtr (Dec 2024)
Prev Qtr (Sep 2025)
YoY %
QoQ %
Revenue
92.35
63.44
45.13
45.6%
104.6%
EBITDA
9.88
4.59
6.54
115.3%
51.1%
PAT
5.55
2.30
3.49
141.3%
59.0%
EPS (₹)
3.84
1.60
2.41
140.0%
59.3%
Annualised EPS (Quarterly ×4): ₹3.84 × 4 = ₹15.36
Commentary time. Revenue almost doubled QoQ. That’s not “slow FMCG compounding”; that’s “festival season + distribution push + capacity utilisation behaving nicely.” EBITDA margins expanded, PAT exploded, and suddenly the company looks like it found the correct spice ratio after years of trial batches.
But remember: FMCG quarters can be moody. One bad raw material cycle and margins start coughing. So yes, clap—but don’t start dancing yet.
5. Valuation Discussion – Fair Value Range (No Crystal Ball, Only Maths)
Method 1: P/E Based
Annualised EPS: ₹15.36
Conservative FMCG multiple (below industry median): 12x–16x