Uflex Ltd Q1FY26 – ₹15,283 Cr Sales, ₹285 Cr PAT, ₹8,353 Cr Debt: Packaging the World, or Just Gift-Wrapping Its Own Problems?
Date of Publishing -
Spotted a factual error — a wrong number, date, or fact? Tell us and we will check the source.
1. At a Glance
Uflex Ltd is India’s packaging dada, claiming to wrap everything from your Maggi packet to Pepsi’s cola dreams. Current market cap stands at ₹3,893 Cr, CMP ₹540 — down 21% in one year. Quarterly revenue is ₹3,901 Cr, PAT ₹58 Cr (down 2.6% YoY), and annual PAT ₹285 Cr. EPS is ₹41.4, P/E a modest 13.7, which looks cheap until you notice the elephant: ₹8,353 Cr debt — almost 3x its market cap. Book value? ₹1,024 per share, so CMP is just 0.53x book. Looks like a “value stock” until you realise ROE is 3.3% and interest coverage is 1.56x. That’s not return on equity, that’s return on anxiety.
2. Introduction
Flexible packaging is like Bollywood item numbers — nobody asks for it, but every blockbuster has one. Uflex claims to be among the world’s top packaging firms, serving Nestle, Pepsi, Amul, and ITC. It has 16 factories across 9 countries, 150+ countries as customers, and a product portfolio so wide it makes your local kirana shop jealous.
But here’s the catch: while it looks global, the balance sheet screams “over-leveraged desi uncle.” PAT has swung from ₹1,099 Cr (FY22) to -₹691 Cr (FY23, forex disaster) and back to ₹299 Cr (FY25). That’s not growth; that’s a roller coaster designed by a drunk engineer.
The biggest red flag? A ₹871 Cr forex loss in FY24 thanks to Egypt and Nigeria exposure. Management says, “It’s notional.” Investors say, “So are your profits.”
3. Business Model – WTF Do They Even Do?
Uflex runs its empire in two main silos:
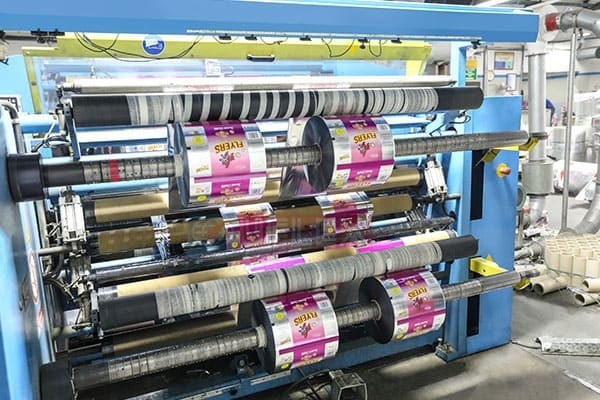
Packaging Films (62% of revenue) – BOPET, BOPP, CPP, metallised films, AIOx coatings, eco-friendly mono-materials, and fancy branded “Asclepius PCR” recycled films. Translation: plastic films that look high-tech but are still plastic.
Value-Added Products (38%)
Packaging (29%): Flexible packs, liquid packaging, aseptic cartons, and holography (yes, they make those shiny stickers to stop fake liquor bottles).
Others (6%): Inks, adhesives, and coatings. Think of them as the masala powders behind every packaged good.
Their clientele list is star-studded: Nestle, Mondelez, Coca-Cola, Pepsi, Amul, Britannia. But top 5 customers = 20% revenue. That’s concentration risk disguised as “prestige.”