1. At a Glance
Rajeshwari Cans is that quirky SME stock which makes tin containers for tobacco and snuff. Yes, while everyone else in packaging dreams of FMCG, e-commerce, or pharma clients, this company literally caters to gutkha pouches and masala tins. Incorporated in 2018, listed in 2021 at ₹20 (IPO price), it now trades at ₹135 — down 62% from its high but still flaunting a P/E of 73. In short: the business is small, margins are okay-ish, but valuations are smoking something stronger than their client base.
2. Introduction
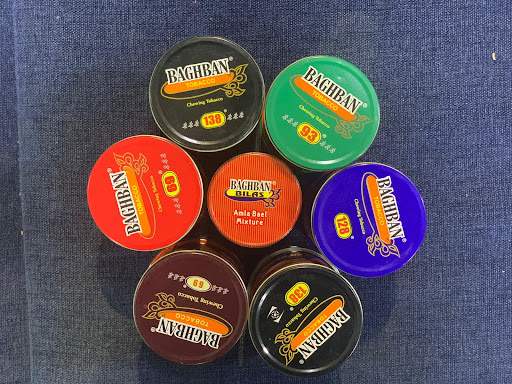
In the packaging world, there are players who serve global FMCG giants, then there are innovators dabbling in bio-degradable solutions, and then… there’s Rajeshwari Cans. Their business model is to sell printed round tin containers (50 gm to 5 kg) and MS drums (5 kg to 30 kg) mainly used in the tobacco/snuff industry.
This makes them a weird niche play. On one hand, tobacco demand in India is evergreen (let’s be honest, gutkha chewers are recession-proof). On the other hand, ESG-conscious investors would rather eat cardboard than touch a company tied so closely to tobacco packaging.
IPO was launched in April 2021 at ₹20, it jumped, crashed, and now trades at ₹135. Still a 6x return for early birds, but the recent -52% fall in 6 months shows SME gravity hits harder than pan masala on an empty stomach.
So, dear readers — would you bet on a company that literally packages addiction? Or is this the kind of ESG sin stock you’d avoid at family functions?
3. Business Model (WTF Do They Even Do?)
- Products: Printed round tins (gutkha/snuff), MS drums for chemicals/tobacco.
- Scale: Sales of ₹40 Cr in FY25 — peanuts compared to packaging majors like Uflex (₹15,000 Cr).
- Clients: Largely tobacco/snuff players — not exactly the “blue-chip client list” that wins awards.
- Moat: Regional monopoly in a very “sticky” industry