1. At a Glance
Basant Agro Tech, born in 1990 under the Bhartia Group, claims to be a farmer’s friend but is more like that cousin who always needs “ek aur loan.” Market cap = ₹137 Cr, sales = ₹474 Cr, profit = just ₹4.4 Cr. ROE = 2.37%, P/E = 31×. Basically, ₹1 of profit costs you ₹31, and the company itself trades at just 0.77× book value. Translation: the market doesn’t trust its own balance sheet, but still gives it a high P/E. Kya mix hai bhai!
2. Introduction
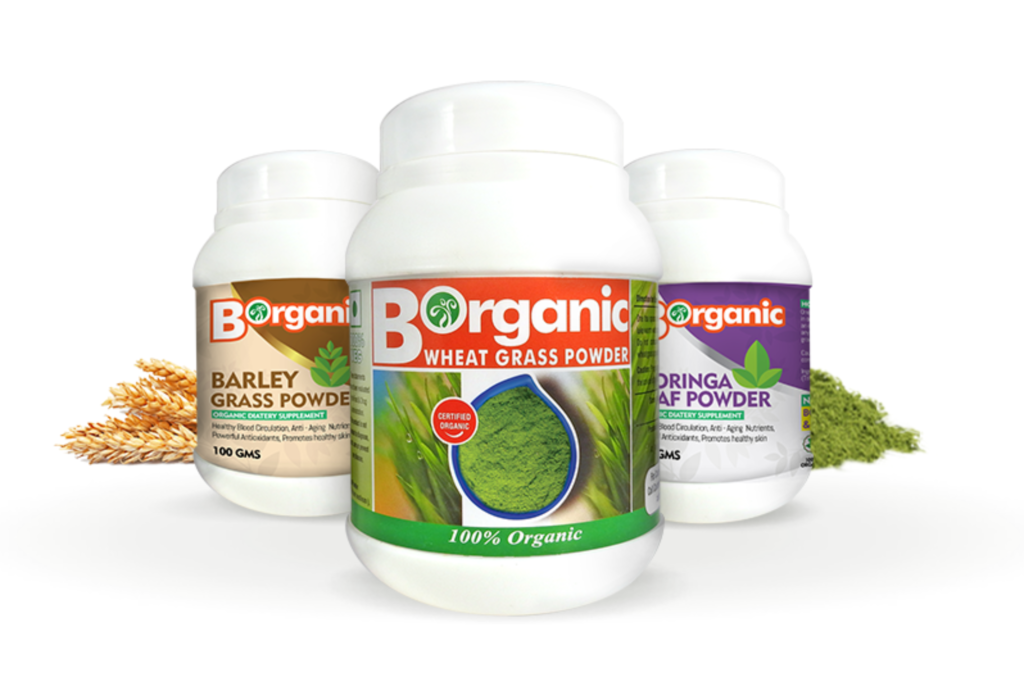
Fertilizers, seeds, agro-chemicals – Basant Agro Tech does it all. And when bored, they also sell barley grass powder, wheat grass powder, and pipes. Oh, and they run windmills too. The diversification feels like a typical Indian thali – everything on one plate, but half the dishes are cold.
The company’s empire includes six manufacturing units, cold storage facilities, and a pipe plant. They make SSP and NPK fertilizers, hybrid seeds, and LABSA (a surfactant chemical used in detergents). Revenue breakup is Fertilizers (57%), Seeds (27%), LABSA (13%), and Others (3%).
On paper, this looks like a farmer-focused powerhouse. In reality, margins are thinner than papad – OPM = 5.9%, PAT margin <1%. With such wafer-thin profits, even a small spike in raw material or subsidy delays can wipe out the bottom line.
3. Business Model – WTF Do They Even Do?
Think of Basant Agro Tech as a mini Reliance (minus the execution, margins, and shareholders’ love):
- Fertilizers → SSP (Single Super Phosphate) & NPK blends tailored for soil needs.
- Seeds → Hybrid field crops, vegetables, oilseeds.
- LABSA Chemicals → Raw material for detergents, soaps.
- Pipes & Plastics → Drip irrigation, sprinklers, HDPE pipes.
- Warehousing & Cold Storage → Rental biz in Maharashtra.
- Windmills → 4 small turbines generating green bragging rights, not profits.
- Organic Products → Moringa powders