1. At a Glance
Urban Enviro Waste Management Ltd (UEWML) – founded in 2011, listed on NSE SME – is basically India’s professional “kachrawala” with a market cap of ₹132 Cr. Sales ₹141 Cr, Profit ₹10 Cr, ROE a juicy 38%. Sounds neat, except the stock price stinks: down 33% in one year. Their business? Collecting, transporting, sweeping, and processing garbage for cities – essentially doing what your local nagarpalika should be doing but doesn’t.
2. Introduction
Welcome to the glamorous world of waste management – where profits come from picking up other people’s trash. Urban Enviro has positioned itself as a nationwide “garbage-as-a-service” provider. From door-to-door collection in Maharashtra to bio-mining dumps in Rajasthan, they’ve turned garbage into contracts.
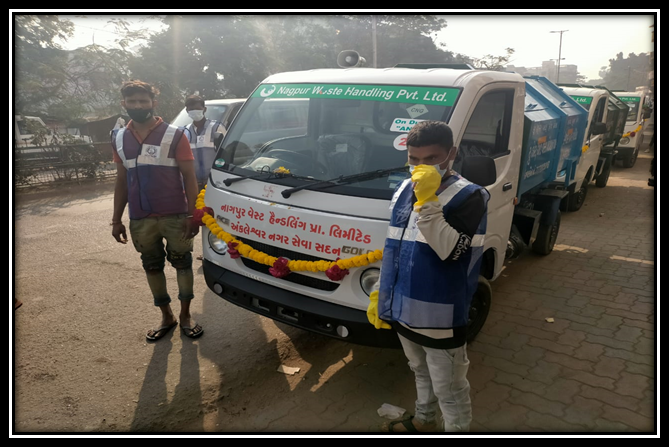
But this isn’t just cleaning lanes; it’s big business. Between FY22 and FY24, revenue grew 5× (₹20 Cr → ₹102 Cr → ₹141 Cr). Fleet grew from 199 to 529 vehicles, including 50 EVs (yes, even garbage has gone electric). Order book for FY25: ₹95 Cr of confirmed contracts – recurring and extendable.
So why is the stock dumped harder than last night’s leftovers? Because growth is hot, but margins, debtor days, and SME risks keep investors wary.
3. Business Model – WTF Do They Even Do?
Urban Enviro earns by signing contracts with municipalities, housing societies, and institutions. They offer:
- Door-to-door garbage collection: 57% of FY24 revenue (up from 10% in FY22). This is their core now.
- Collection & transportation: 24% (down from 62% in FY22). Basically trucks moving waste to landfills.
- Supplying manpower: 9%. Labour outsourcing, nothing fancy.
- Garbage processing: 7% (new vertical: sorting, recycling, composting).
- Cleaning & sweeping: 3% (used to be 18% in FY22). From brooms to vacuum trucks.
- Bio-mining: small but emerging. Digging old dumps, extracting usable material, refilling.
The twist? Recurring contracts mean