1. At a Glance
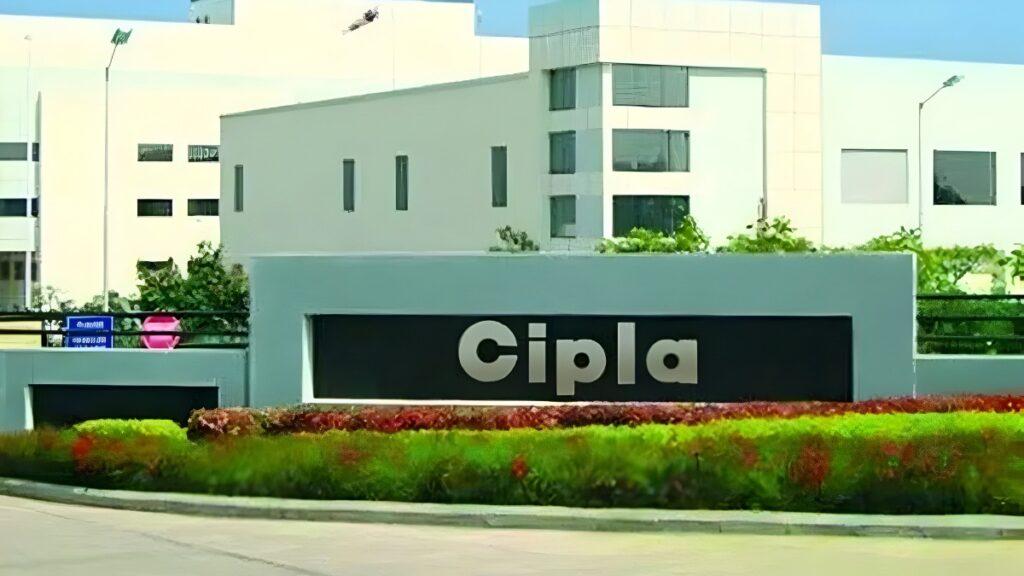
Cipla isn’t just a pharma company—it’s India’s third-largest prescription empire with1,500+ products, 65 therapy categories, and 7,500 field reps. They practically have a pill, inhaler, or syrup for everything from asthma to awkward family dinners. With FY25 revenue at₹27,811 croreand profits of₹5,392 crore, Cipla has one of the cleanest balance sheets in Indian pharma (debt: ₹438 crore = pocket change). They dominate respiratory drugs (22% market share, rank #1), hold the #2 spot in chronic care, and are sprinting up the ladder in the U.S. generics market.
2. Introduction
If you’ve ever used an inhaler in India, chances are Cipla’s name was stamped on it. The company is a respiratory drug kingpin, holding overone-fifth of India’s respiratory market. But they don’t stop at asthma—they’re also top 5 inurology, anti-infectives, and cardiac care.
Globally, Cipla is thefastest-growing generic player in North America, top 3 in South Africa’s private prescription market, and still manages to crank out consumer hits likeNicotex (for smokers), Omnigel (for your back pain after playing cricket once in 6 months), and Cofsils (your throat’s best friend during Delhi winters).
What makes Cipla fascinating is its balance of old-school pharma scale with new-age experiments—investments incell & gene therapy, mRNA platforms, biologics through Kemwell JV, and even point-of-care diagnostic devices like Cippoint. In short, Cipla isn’t just making pills—it’s building a healthcare theme park.
3. Business Model (WTF Do They Even Do?)
Cipla makes and sells medicines. That’s the kindergarten answer. But here’s the grown-up version:
- Therapy Spread:
- Respiratory – 22.2% market share (#1, their crown jewel).
- Urology – 14.2% market share (#1 again).
- Anti-infectives – 6.9% share (#4).
- Cardiac – 5.3% share (#5).
- Gastro – 2.9% share (#9).
- Anti-diabetics – 0.8% share (#27, i.e., practically invisible).
- Revenue Contribution FY22:Respiratory (37%), Anti-infectives (16%), Cardiac (12%), GI (6%), Urology (5%), rest spread like a thali.
- API Business:200+ APIs supplied to 62 countries. Strong backward integration = less China dependence.
- Geographic Split (FY23):
- India: 43%
- North America: 26%
- SAGA: 14%
- EMEU: 13%
- Others: 4%
- R&D Muscle:5 centers, 1,650 scientists, ₹1,343 crore spent in FY23 (~6% of revenue). They launched78 products in FY23, and 30 in 9M FY24. Patents granted: 303 till FY23.
Verdict: Cipla doesn’t just play in one league—it’s playing cricket, football, kabaddi, and chess simultaneously.
4. Financials Overview
| Metric | Latest Qtr (Jun ’25) | YoY Qtr (Jun ’24) | Prev Qtr (Mar ’25) | YoY % | QoQ % |
|---|---|---|---|---|---|
| Revenue | ₹6,957 Cr | ₹6,694 Cr | ₹6,730 Cr | 3.9% | 3.4% |
| EBITDA | ₹1,778 Cr | ₹1,716 Cr | ₹1,538 Cr | 3.6% | 15.6% |
| PAT | ₹1,298 Cr | ₹1,175 Cr | ₹1,214 Cr | 10.2% | 6.9% |
| EPS (₹) | 16.1 | 14.6 | 15.1 | 10.3% | 6.6% |
Commentary:Cipla is delivering consistency with a side of growth. Annualized EPS ~₹64 → P/E ~24x. That’s cheaper than Sun Pharma (34x) and Torrent (61x), but pricier than Dr. Reddy’s (19x).
5. Valuation (Fair Value Range Only)
- P/E Method:EPS ~₹64. Fair industry multiple = 22–30. FV =₹1,400–₹1,900.
- EV/EBITDA Method:EV ~₹1.26 lakh crore. EBITDA ~₹8,100 Cr. EV/EBITDA = 15.5x vs peers 15–20x. FV =₹1,500–₹1,850.
- DCF:Assuming 12% CAGR till 2030, WACC 9%, terminal 3% → FV =₹1,600–₹2,000.
👉Consolidated FV Range: ₹1,400–₹2,000Disclaimer: This FV range is for educational purposes only and not investment advice.
6. What’s Cooking – News, Triggers, Drama
- FDA Update:Aug 2025 – Bommasandra (Bengaluru) plant inspection cleared as “VAI” (Voluntary Action Indicated). Translation: No

