1. At a Glance
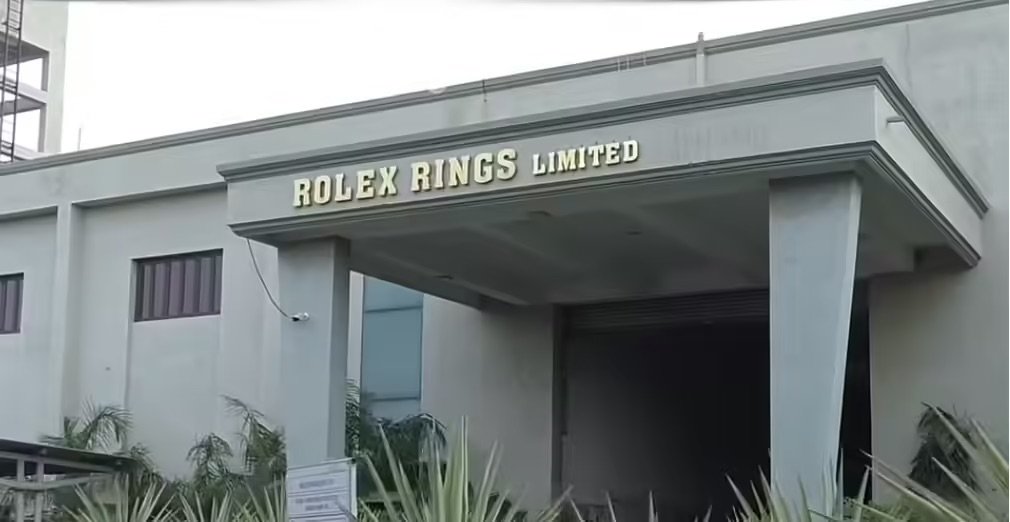
Rolex Rings Ltdis one of India’stop 5 forging companies, manufacturing forged and machined components likebearing rings, engine parts, gear blanks, and transmission components. With3 plants in Rajkot, Gujarat, a1,65,000 MTPA forging capacity, and a75 million machining capacity, the company caters to auto, industrial, and renewable sectors across15+ export countries.
It’s arare mix of almost debt-free balance sheet, 20% operating margins, and 90% renewable energy reliance. However, topline has been stagnant, exports are weak due to Europe slowdown, and promoter stake has dipped to53.4%from 57.6% (3 years back).
At₹1,374/share (P/E 20.3 vs industry 27.2), Rolex trades at a fair discount to peers—market seems to be punishing itslow growthdespite strong profitability.
2. Introduction
Incorporated in Rajkot, Rolex Rings has built its reputation onhigh-precision forgings and bearings, supplying to marquee clients likeSKF, Schaeffler, Carraro, Ford, and ABC Bearings. The company serves multiple industries:
- Auto Components (54% of sales, Q1 FY25)– engine, transmission, chassis, exhaust parts
- Bearings (46% of sales)– TRBs, CRBs, SRBs, deep-groove ball bearings, etc.
Export revenues are nearly half of sales, but recent weakness inEurope (Germany, Italy, France)dented bearing demand. Meanwhile,domestic business has grown to 51%of sales.
3. Business Model – “Forging the Backbone of Motion”
- Revenue Split (Q1 FY25): Auto Components (54%), Bearings (46%)
- End-user Split: Passenger Vehicles (46%), CV/HCV (27%), BEV/Hybrids (9%), Industrials (18%)
- Clients
- : Ford, SKF, Schaeffler, Carraro, Automotive Axles Ltd
- Customer Concentration: Top 10 customers = 80% of revenue
Moat:Engineering precision + high entry barriers in forged bearing rings → sticky customer relationships.
4. Financials Overview (Q1 FY26 – Jun 2025)
| Metric | Jun 2025 | Jun 2024 | YoY % | QoQ % |
|---|---|---|---|---|
| Revenue | ₹292 Cr | ₹311 Cr | -6.2% | +2.8% |
| EBITDA | ₹62 Cr | ₹71 Cr | -12.7% | +19% |
| PAT | ₹49 Cr | ₹50 Cr | -1.5% | Flat |
| OPM % | 21% | 23% | ↓200 bps | ↑300 bps |
Commentary:Revenue remains flat-to-declining, but margins are resilient. Cost optimization + renewable energy savings (₹13.5 Cr/year) offset weak sales.
5. Valuation (Fair Value RANGE only)
- EPS (TTM):₹63.6
- Current P/E:20.3
- Industry P/E:27.2
🔹P/E method:27.2 × 63.6 =₹1,730🔹EV/EBITDA method:EBITDA ~₹269 Cr; EV/EBITDA 12–14× → EV ₹3,200–3,750 Cr → FV per share =₹1,175 – 1,375🔹DCF (assuming 10% CAGR sales, 15% PAT margins, 20% growth FY26–27):FV per share =₹1,500 – 1,700
Educational FV Range:₹1,200 – ₹1,700Disclaimer:
