1. At a Glance
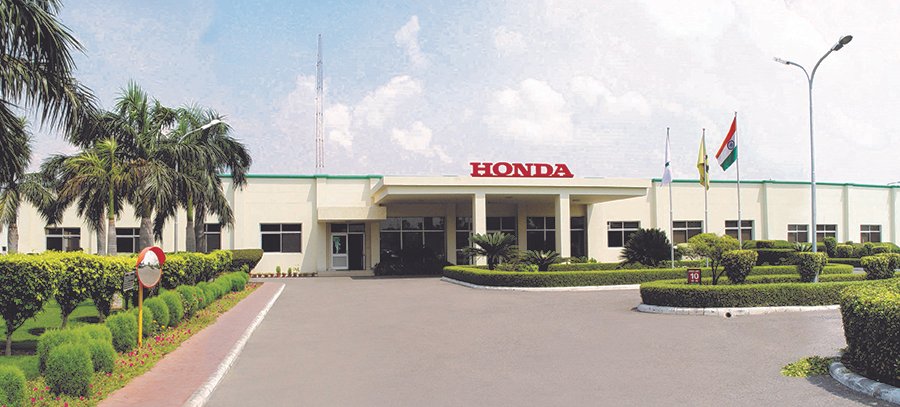
Honda India Power Products (HIPP) just dropped a1000% dividendbomb while the core business barely lit a spark plug. This ex-Siel engine player may have a balance sheet clean enough to eat off, but its revenue graph looks like it’s running on low-octane diesel. FY25 sales down 20%, PAT slipping, and growth… still on vacation. And yet, the stock trades at~40x P/E. Why? Let’s crank the generator and find out.
2. Introduction – Dividend Dynamo with a Growth Deficit
Imagine this: a company sells power products, has global branding from the Honda mothership, and zero debt. Sounds lit, right? Except the only thing revving is the dividend payout.
Sales are declining faster than your gym enthusiasm in February. PAT is down YoY. And debtor days? Gone from a healthy 20 to54 days—customers are ghosting like it’s a bad Tinder date.
And yet, investors cling on, hypnotized by that sweet 1000% interim dividend. But behind that juicy payout lies a company struggling to defend its turf against cheaper gensets, unorganized imports, and slow industrial capex.
3. Business Model – WTF Do They Even Do?
HIPP is a manufacturer and marketer of:
- Portable Generators
- Water Pumps
- General Purpose Engines
- Brush Cutters
- Tillers
- Lawn Mowers
These products are sold under the Honda brand (you know, the one with actual brand recall), and serve use-cases across agriculture, rural households, infrastructure sites, and landscaping.
The twist? They also export, but even that’s losing steam.
And just this quarter, theyamended their MoA to add electric motors. Are they planning a pivot? Or just charging the battery for the EV train? Only time will tell.
4. Financials Overview – Clean Sheets, Flatlined Growth
TTM Revenue: ₹805 CrTTM PAT: ₹73 CrEPS: ₹72.24P/E: 39.7xROE: 9.5%ROCE: 12.9%Debt: ZERO
OPM: 10%
YoY revenue isdown20%. PAT isdown13%. And that 40x valuation? That’s because Honda is treating this company like an ATM machine—high dividend, low reinvestment.
Operating cash flow in FY25: ₹22 Cr.Dividend paid in FY25: ₹40 Cr+ 😵💫
5. Valuation – Fair Value Range (Adjust the Choke)
Method 1: P/E Based
EPS = ₹72.24Realistic P/E Range for declining manufacturing = 15x–25x→ FV Range = ₹1,083 – ₹1,806
Method 2: EV/EBITDA
TTM EBITDA ≈ ₹80 CrEV/EBITDA Range = 10x–12xEV = ₹800 – ₹960 CrNet Cash = ~₹200 Cr→ Equity Value = ₹1,000 – ₹1,160 Cr→ FV per Share = ₹1,000 – ₹1,160
Method 3: DCF
Assume flat growth, terminal value high due to dividend, Discount Rate = 11%→ FV Range = ₹1,200 – ₹1,700
| Method | FV Range (₹) |
|---|---|
| P/E | 1,083 – 1,806 |
| EV/EBITDA | 1,000 – 1,160 |
| DCF | 1,200 – 1,700 |
“This FV range is for educational purposes only and is not investment advice.”
6. What’s Cooking – News, Triggers, Drama
- Q1FY26 Results: Sales down to ₹154 Cr, PAT just ₹9.5 Cr → 41% fall


