At a Glance
Sangam India just dropped its Q1 FY26 results, and let’s just say the numbers are as tight as their denim. Revenue stood at ₹789.8 crore, up modestly 13.96% YoY, but profits collapsed like a bad stitch – PAT was only ₹2.13 crore, down 77% YoY. Margins are slimmer than a runway model’s diet at just 7.3% OPM. With a P/E of 86.7, investors are clearly paying designer prices for a brand that’s struggling to keep its seams together.
Introduction
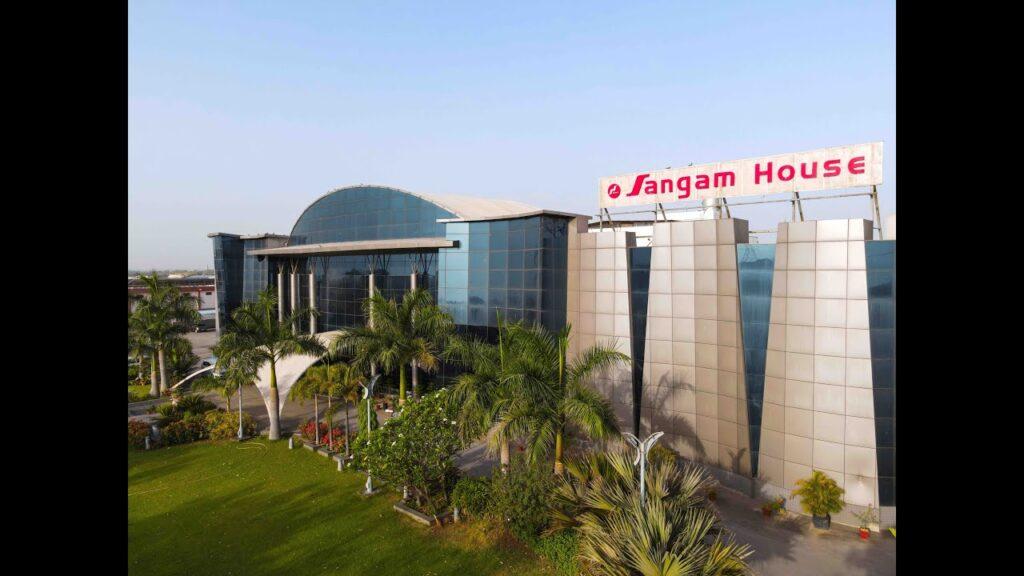
Imagine a textile company that has the market share swagger of a king but the profit margins of a roadside tailor – welcome to Sangam India. Known for being a leading manufacturer of PV dyed yarn, fabrics, and denim, Sangam walks around with the title of “market leader”, yet its financials keep whispering, “please send help.”
Over the past few years, the company has danced on the edge of profitability, sometimes turning a neat profit, other times burning cash like a bonfire. Q1 FY26 confirms the struggle continues – revenues improved, but profit fell faster than a dropped bobbin. At this point, the company’s narrative feels like a slow-burning soap opera where the lead actor can’t decide between survival and a dramatic exit.
Business Model (WTF Do They Even Do?)
Sangam India’s business revolves around manufacturing and selling:
- Synthetic Blended Yarn
- Cotton & Texturised Yarn
- Fabrics & Denim Fabrics
- Seamless Garments
They’re one of the largest PV yarn and denim fabric players in India, with a vertically integrated model. That’s fancy talk for controlling everything from spinning to stitching, giving them cost advantages – at least on paper.
The problem? Global cotton price volatility, intense competition, and rising interest expenses. Sangam makes great fabrics, but its P&L looks like it was stitched together in a hurry.
Financials Overview
Q1 FY26 Snapshot:
- Revenue: ₹789.8 crore (↑13.96% YoY)
- EBITDA: ₹57.6 crore (↓ YoY)
- PAT: ₹2.13 crore (↓77% YoY)
- EPS: ₹0.47
Operating margins fell to 7.3% from ~8% last year. Interest expense jumped to ₹30.3 crore (vs ₹23.1 crore YoY), which ate into profits like a hungry termite.
P/E = 86.7 – expensive for a company whose profit just fell off a cliff.
Valuation
Let’s play valuation detective:
- P/E Method
- EPS (TTM) = ₹4.35
- Sector P/E ≈ 25
- Fair Value = 4.35 × 25 = ₹109
- EV/EBITDA
- EBITDA (TTM) ≈ ₹235 crore
- EV/EBITDA industry multiple ≈ 8×
- Fair Value = ₹1,880 crore / Shares ≈ ₹225
- DCF (Assume 10% growth, 12% discount)
- Even with optimistic cash flows, the DCF lands around ₹200–₹250.
Fair Value Range: ₹200 – ₹250
Current price ₹417 suggests investors believe in a denim-led miracle.
What’s Cooking – News, Triggers, Drama
- Expansion Projects: Company continues capex in garments and denim capacity.
- Interest Cost Pressure: Debt-fueled expansion weighs heavy.
- Margins Under Siege: Rising raw material and power costs continue to squeeze.
- Market Trigger: Any sign of margin recovery could push the stock higher; another bad quarter and P/E might fall back to earth.
Balance Sheet
| Item | Mar 2025 (₹ Cr.) |
|---|---|
| Assets | 2,955 |
| Liabilities | 1,849 (Borrowings + Other Liabilities) |
| Net Worth | 1,007 |
| Borrowings | 1,138 |
Auditor’s Joke: “Assets look decent, liabilities look scary – call it a balanced imbalance.”
Cash Flow – Sab Number Game Hai
| Year | Ops (₹ Cr.) | Investing (₹ Cr.) | Financing (₹ Cr.) |
|---|---|---|---|
| FY23 | 216 | -354 | 143 |
| FY24 | 160 | -390 | 230 |
| FY25 | 431 | -372 | -36 |
Auditor Note: Cash from operations is strong, but they love throwing it all into capex like a shopaholic with a credit card.
Ratios – Sexy or Stressy?
| Metric | Value |
|---|---|
| ROE | 3.67% |
| ROCE | 6.94% |
| P/E | 86.7 |
| PAT Margin | 0.27% |
| D/E | 1.1 |
Commentary: ROE is barely breathing, and PAT margin is thinner than tissue paper.
P&L Breakdown – Show Me the Money
| Year | Revenue (₹ Cr.) | EBITDA (₹ Cr.) | PAT (₹ Cr.) |
|---|---|---|---|
| FY23 | 2,712 | 302 | 131 |
| FY24 | 2,628 | 215 | 41 |
| FY25 | 2,857 | 245 | 32 |
Commentary: Revenue grows, profits shrink. The company is spinning yarns but not profits.
Peer Comparison
| Company | Revenue (₹ Cr.) | PAT (₹ Cr.) | P/E |
|---|---|---|---|
| KPR Mill | 6,388 | 797 | 45.7 |
| Trident | 6,951 | 436 | 33.8 |
| Vardhman Textile | 9,861 | 852 | 14.2 |
| Sangam India | 2,954 | 20 | 86.7 |
Roast: Sangam trades at a higher P/E than KPR and Trident while earning less than your local boutique.
Miscellaneous – Shareholding, Promoters
- Promoter Holding: 70.17% – rock solid, they’re not giving up.
- FII Holding: 2.64% – tiny but slightly increasing.
- Public Holding: 25.50% – retail investors riding the denim dream.
No major M&A buzz, just steady expansion and rising debt.
EduInvesting Verdict™
Sangam India is a paradox: a market leader in yarn and denim with shrinking margins and profits. Q1 FY26 paints a grim picture – while revenue rose, net profit crashed 77% YoY, leaving investors questioning the ₹417 stock price.
The company’s high leverage, thin margins, and capex addiction keep it on a risky path. Yes, they have scale, brand strength, and vertical integration, but execution and cost control are the missing threads in this fabric.
SWOT Analysis
- Strengths: Market leader in PV yarn, strong promoter holding.
- Weaknesses: Low margins, high debt, interest burden.
- Opportunities: Export growth, product diversification.
- Threats: Raw material price hikes, global demand slowdown.
For investors, Sangam is a high-P/E stock priced like Gucci but earning like roadside denim. Unless margins improve dramatically, this fabric might fray sooner than expected.
Written by EduInvesting Team | 01 Aug 2025
SEO Tags: Sangam India, textiles, denim, Q1 FY26 results, margin pressure


