At a Glance
PNGS Gargi Fashion Jewellery just dropped its Q1 FY26 results and let’s just say – the numbers are sparkling, but not quite Titan-level blinding. With revenue at ₹27.31 Cr (down 38.5% YoY) and PAT at ₹5.31 Cr (down 49% YoY), the bling clearly lost some shine. Despite this, the company flaunts a massive ROCE of 58% and ROE of 45%. Investors, hold onto your earrings, because preferential share issues and expansion plans are on the runway.
Introduction
When your brand screams “Gargi by P. N. Gadgil”, expectations naturally skyrocket. But Q1 FY26 tells us even jewellery brands need polishing. The company reported shrinking top and bottom lines while simultaneously announcing ambitious expansion. The stock is still trading at a P/E of 38.5 – clearly, Mr. Market believes in its sparkle. But should you? Sit tight, because this deep dive will dissect every gem and every fake stone in Gargi’s crown.
Business Model (WTF Do They Even Do?)
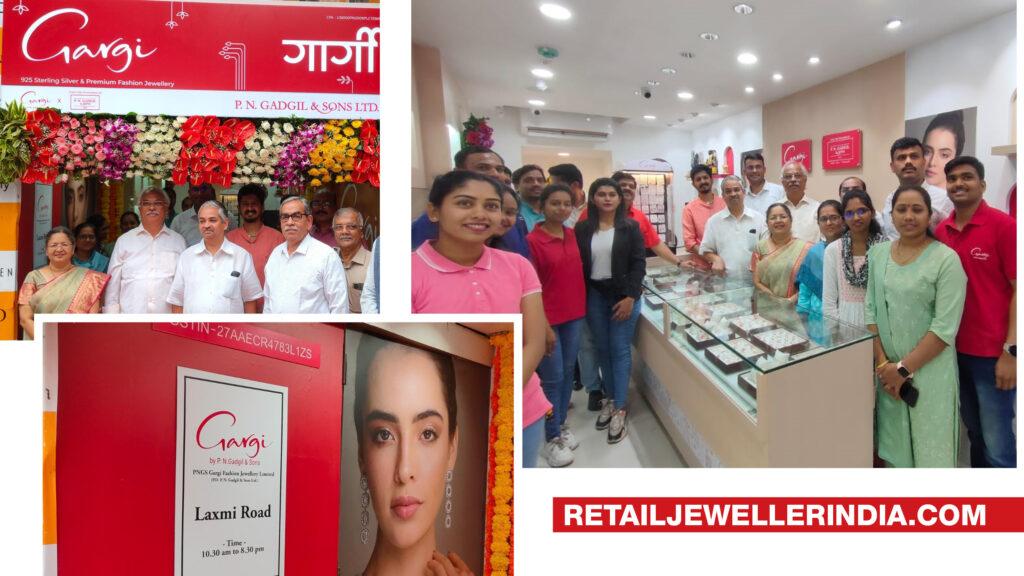
PNGS Gargi is not Titan. Let’s get that out of the way. This is a nimble, SME-listed fashion jewellery player under the PNG umbrella. They sell 92.5% sterling silver, brass, copper jewellery, idols, and more recently, 14-carat gold with natural diamonds. Basically, they are chasing the millennial/Gen-Z crowd who want affordable bling with “Instagram credibility”.
The kicker? They run with a light asset model, relying on online plus select offline presence (~1 online store, ~36 offline outlets, 1M designs). High margins, low debt, and expanding categories (gold-studded jewellery) keep them trending. But competition? Oh boy, it’s a gladiator arena with Titan, Kalyan, and Thangamayil breathing fire.
Financials Overview
Revenue: ₹27.31 Cr (Q1 FY26), down from ₹44.45 Cr last year
EBITDA: ₹6.35 Cr, OPM at 23.2%
PAT: ₹5.31 Cr, profit margins at 19.5%
EPS: ₹5.13 (vs ₹10.86 YoY)
Annual FY25 saw ₹126 Cr revenue and ₹29 Cr PAT – a staggering growth story from ₹50 Cr sales in FY24. But Q1 FY26 hints at a reality check. Growth is no longer exponential, and debtor days creeping up to 40 from 18 is a sign of tightening cash flows. Still, no debt, juicy ROCE, and fat margins keep the thesis alive.
Valuation
Time to whip out the calculators:
- P/E Method:
Current EPS (TTM) ~ ₹22.8, P/E ~ 38.5
Fair P/E range for niche jewellery players? 25–35.
Fair Value: ₹570–₹800 - EV/EBITDA Method:
EBITDA FY25 ~ ₹37 Cr, EV/EBITDA at SME levels 20–22x
EV fair value ~ ₹740–₹800 - DCF (very optimistic):
Assume 20% CAGR for 5 years (optimism alert), terminal growth 5%, WACC 12%
DCF Value: ₹750
Verdict: Overvalued? Maybe slightly. Fair range ₹570–₹800.
What’s Cooking – News, Triggers, Drama
- Preferential share issue – Fresh funds for expansion. Dilution alert? Yes. Growth booster? Also yes.
- Promoter reclassification – BSE approved moving some promoter group to public. Corporate governance tick mark, but why now?
- Expansion Plans – New stores and inventory build-up funded by that preferential issue.
- Macro Tailwinds – Festive seasons ahead could save Q2/Q3.
Balance Sheet (Auditor Comedy Night)
| Assets | ₹ Cr | Liabilities | ₹ Cr |
|---|---|---|---|
| Total Assets | 117 | Borrowings | 4 |
| Reserves | 89 | Other Liabilities | 14 |
| Equity Capital | 10 | Total Liabilities | 117 |
Remarks: Zero debt almost, high reserves – clean like a freshly polished diamond. Borrowings? Just ₹4 Cr, basically pocket change.
Cash Flow – Sab Number Game Hai
| ₹ Cr | Mar 2023 | Mar 2024 | Mar 2025 |
|---|---|---|---|
| Ops | 2 | -11 | 18 |
| Investing | -1 | 0 | -39 |
| Financing | 10 | 1 | 39 |
Remarks: Negative investing CF in FY25 = expansion spending. Financing inflows = raising funds to fuel growth. Ops cash bounce-back is good but watch sustainability.
Ratios – Sexy or Stressy?
| Ratio | Value |
|---|---|
| ROE | 44.8% |
| ROCE | 57.9% |
| P/E | 38.5 |
| PAT Margin | 27% |
| D/E | 0.04 |
Remarks: Ratios scream “sexy” with high returns and low leverage. P/E is the only drama queen.
P&L Breakdown – Show Me the Money
| ₹ Cr | FY23 | FY24 | FY25 |
|---|---|---|---|
| Revenue | 29 | 50 | 126 |
| EBITDA | 7 | 11 | 37 |
| PAT | 5 | 8 | 29 |
Remarks: From ₹29 Cr revenue to ₹126 Cr in two years – Cinderella story. But Q1 FY26 shows she might miss the midnight carriage.
Peer Comparison
| Company | Rev (Cr) | PAT (Cr) | P/E |
|---|---|---|---|
| Titan | 60,456 | 3,336 | 89 |
| Kalyan | 25,045 | 714 | 87 |
| PN Gadgil | 7,586 | 219 | 36 |
| PNGS Gargi | 109 | 24 | 38 |
Remarks: Against giants, Gargi is a toddler with a tiara. But toddler is learning fast.
Miscellaneous – Shareholding, Promoters
- Promoters: 70.21% (down from 73% – slight dilution)
- DIIs: 1.09% (finally noticed!)
- Public: 28.7%
Promoters: The Gadgil family, jewellery royalty. Public loves the brand, institutions are peeking in.
EduInvesting Verdict™
PNGS Gargi is the definition of a high-margin, low-debt, high-growth SME. The brand’s aggressive expansion and entry into gold-studded diamond jewellery diversify its portfolio. However, Q1 FY26 signals caution – revenue and profit took a nosedive. Add to that rising debtor days and planned dilution, and we’ve got a cocktail of glitter with a hint of rust.
SWOT Quickie:
- Strengths: Strong brand, insane ROE/ROCE, debt-free.
- Weaknesses: Small scale, high P/E, YoY profit drop.
- Opportunities: Expansion, festive demand, gold-diamond entry.
- Threats: Big guns like Titan/Kalyan, volatility in consumer spending.
For investors: this is not a Titan 2.0 (yet). It’s a growth stock with volatility and valuation risk. For traders? Festive season could give it a short-term sparkle. For long-term holders? Only if you like your jewellery investments high-risk-high-reward.
Written by EduInvesting Team | 30 July 2025
SEO Tags
PNGS Gargi Fashion Jewellery, SME stocks, jewellery sector, Titan vs Gargi, Q1 FY26 results