At a Glance
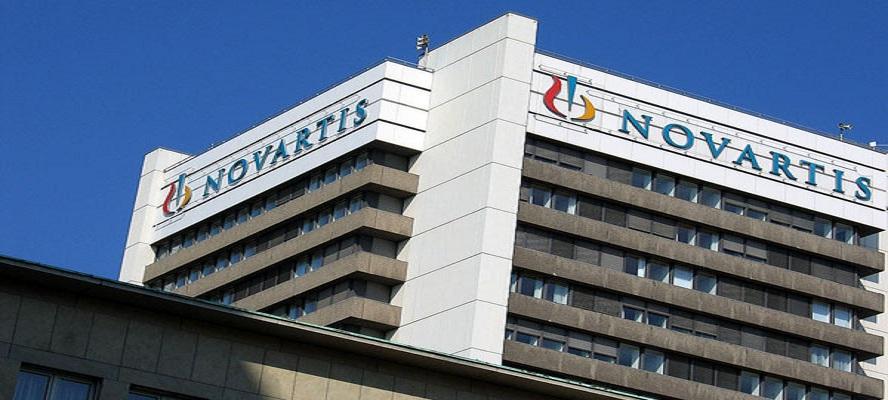
Novartis India has released its Q1 FY26 results and the numbers are a mixed cocktail: Sales ₹88 Cr (-5% YoY), but Net Profit ₹28 Cr (+7% YoY) thanks to tight cost control and juicy other income. Margins hit 31% OPM, the highest in years. The stock trades at a P/E of 24, with a 2.5% dividend yield, and still looks like the pharmaceutical tortoise – slow but steady. However, stagnant top-line growth is raising eyebrows.
1. Introduction
Novartis India, the local arm of the Swiss giant, continues to operate as a niche pharma player focused on imports and specialized segments. While profit growth is decent, revenue growth has been stuck in a coma, thanks to a shrinking product portfolio and increased competition. Investors must decide: is this a defensive play or just dead money wrapped in a dividend?
2. Business Model (WTF Do They Even Do?)
- What: Imports and markets pharma products in India.
- Segments: Pain management, organ transplantation, neuroscience, and specialty medicines.
- Revenue Mix: Mostly from imported branded drugs.
Roast: They sell life-saving drugs but their revenue growth could use a dose of steroids.
3. Financials Overview
Q1 FY26 Snapshot
- Revenue: ₹88 Cr (-5% YoY)
- EBITDA: ₹27 Cr (OPM 31%)
- Net Profit: ₹28 Cr (+7% YoY)
- EPS: ₹11.2
Takeaway: Profit up, sales down – a classic cost-cutting-driven quarter.
4. Valuation
- P/E: 24x – not cheap for a flat-growth pharma stock.
- P/B: 3.1x – brand premium still priced in.
- Fair Value Range: ₹850 – ₹1,050.
At current levels, it’s priced for stability, not growth.
5. What’s Cooking – News, Triggers, Drama
- Cost auditor appointed – governance in place.
- AGM on July 31 – potential for updates on product launches.
- Portfolio contraction continues; limited growth drivers.
- High dividend payout (82%) makes it a yield play.
6. Balance Sheet
| (₹ Cr) | Mar 2024 | Mar 2025 |
|---|---|---|
| Total Assets | 925 | 948 |
| Borrowings | 7 | 5 |
| Net Worth | 744 | 785 |
Auditor’s Joke: Almost no debt – if only growth were as healthy as the balance sheet.
7. Cash Flow – Sab Number Game Hai
| (₹ Cr) | Mar 2023 | Mar 2024 | Mar 2025 |
|---|---|---|---|
| Operating Cash | 45 | 113 | 75 |
| Investing Cash | -153 | 33 | -3 |
| Financing Cash | -30 | -121 | -64 |
Comment: Stable cash flows, strong cash reserves – a dividend lover’s delight.
8. Ratios – Sexy or Stressy?
| Ratio | 2023 | 2024 | TTM |
|---|---|---|---|
| ROE | 12% | 13% | 13.2% |
| ROCE | 16% | 17% | 17% |
| OPM | 19% | 26% | 31% |
| D/E | 0.0 | 0.0 | 0.0 |
Verdict: Margins are sexy, growth is stressy.
9. P&L Breakdown – Show Me the Money
| (₹ Cr) | FY23 | FY24 | TTM |
|---|---|---|---|
| Revenue | 379 | 356 | 352 |
| EBITDA | 65 | 91 | 95 |
| Net Profit | 103 | 101 | 103 |
Comment: Profit flatlines, sales shrink – not inspiring.
10. Peer Comparison
| Company | P/E | ROE | OPM |
|---|---|---|---|
| Sun Pharma | 36 | 17% | 29% |
| Dr. Reddy’s | 19 | 18% | 25% |
| Cipla | 24 | 18% | 26% |
| Novartis India | 24 | 13% | 27% |
Verdict: Valuation in line, growth lagging peers.
11. Miscellaneous – Shareholding
- Promoters: 70.7%
- FIIs: 0.2%
- DIIs: 0.5%
- Public: 28.6%
12. EduInvesting Verdict™
Novartis India remains a stable, low-risk pharma stock with high margins and dividends. However, its stagnant revenue and lack of new growth triggers keep it firmly in “boring but safe” territory. Perfect for investors who like slow, predictable returns – but growth hunters should look elsewhere.
SWOT Analysis
- Strengths: Strong brand, high margins, debt-free.
- Weaknesses: Shrinking revenue, reliance on imports.
- Opportunities: New drug launches, partnerships.
- Threats: Price control, competition, portfolio reduction.
Final Word: Good for conservative investors seeking stability and dividends. Growth-seekers? Look at Sun or Cipla.
Written by EduInvesting Team | 29 July 2025
SEO Tags: Novartis India, Q1 FY26 Results, Pharma Stocks, Dividend Stocks


