1. At a Glance
India’s biggest eyecare chain with 25% market share, now listed and flexing a P/E of 170. Revenue FY25: ₹1,711 Cr, Net Profit: ₹110 Cr, yet no dividends. Investors stare at the stock and whisper – “premium vision, premium price.”
2. Introduction with Hook
If hospitals were Bollywood actors, Dr. Agarwal’s is the superstar charging ₹500 for a selfie. The chain’s growth is laser-sharp – revenue CAGR 26% over 5 years – but margins squint under high expansion costs. Eye surgeries are booming, but so is the P/E!
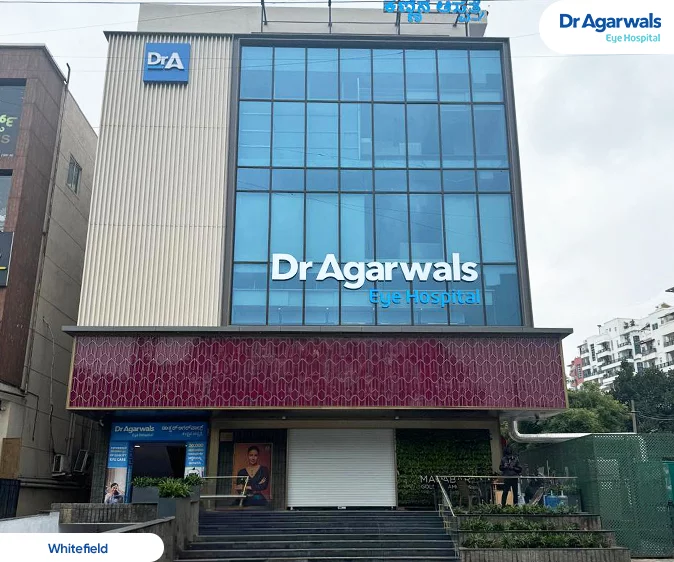
3. Business Model (WTF Do They Even Do?)
- Primary Biz: Eye-care services – cataract, refractive, glaucoma, retina, cornea.
- Secondary Biz: Optical products, lenses, pharma eye-care.
- Expansion Mode: Aggressive hospital additions pan-India.
Basically, they fix your vision while blinding you with the bill.
4. Financials Overview
- Revenue (FY25): ₹1,711 Cr
- Operating Profit: ₹456 Cr (OPM ~27%)
- Net Profit: ₹110 Cr
- ROCE: 10.4%
- ROE: 5.3%
Margins stable, profits improving, leverage high due to hospital capex.
5. Valuation
- P/E: 170 (priced like it cures blindness with a tweet)
- P/B: 7.8x
Fair Value Range: ₹280–₹350. Anything above is growth on steroids.
6. What’s Cooking – News, Triggers, Drama
- Expansion spree across Tier-2/3 cities.
- High FII holding (59%) – they love this growth story.
- Promoter stake stable (~32%), with internal share transfers.
- No dividend, because “growth eats cash.”
7. Balance Sheet
Particulars | FY24 | FY25 |
---|---|---|
Assets | ₹2,751Cr | ₹3,672Cr |
Liabilities | ₹1,410Cr | ₹1,805Cr |
Borrowings | ₹966Cr | ₹961Cr |
Net Worth | ₹1,339Cr | ₹1,867Cr |
Debt moderate, assets growing faster than profits.
8. Cash Flow – Sab Number Game Hai
Particulars | FY24 | FY25 |
---|---|---|
Operating CF | ₹346Cr | ₹360Cr |
Investing CF | ₹-914Cr | ₹-750Cr |
Financing CF | ₹553Cr | ₹382Cr |
Cash burnt in expansion like a startup, financed partly by debt & equity.
9. Ratios – Sexy or Stressy?
Ratio | Value |
---|---|
ROE | 5.3% |
ROCE | 10.4% |
PAT Margin | 6.4% |
D/E | 0.5x |
P/E | 170 |
Sexy growth, stressy returns.
10. P&L Breakdown – Show Me the Money
Year | Revenue | EBITDA | PAT |
---|---|---|---|
FY23 | ₹1,018Cr | ₹275Cr | ₹103Cr |
FY24 | ₹1,332Cr | ₹367Cr | ₹95Cr |
FY25 | ₹1,711Cr | ₹456Cr | ₹110Cr |
Strong revenue growth, PAT finally catching up.
11. Peer Comparison
Company | Revenue (₹Cr) | PAT (₹Cr) | P/E |
---|---|---|---|
Max Healthcare | 7,028 | 1,132 | 110 |
Apollo Hosp. | 21,794 | 1,446 | 74 |
Dr. Agarwal’s | 1,711 | 110 | 170 |
Small in size, big on valuation.
12. Miscellaneous – Shareholding, Promoters
- Promoters: 32.4%
- FIIs: 59%
- DIIs: 6.4%
- Public: 1.9%
Clearly an FII darling.
13. EduInvesting Verdict™
A high-growth hospital chain expanding like a caffeinated octopus. However, the stock trades like it’s curing blindness and myopia with magic. Watch for execution, keep an eye on debt, and maybe wear sunglasses when looking at the P/E.
Written by EduInvesting Team | 27 July 2025
Tags: Dr. Agarwal’s Health Care, Eye Care, Hospital Stocks, High P/E, EduInvesting Premium