1. At a Glance
India’s OG plastic lender is back — with ₹4,877 Cr in revenue, ₹556 Cr in net profit, and an NPA that’s quietly creeping like your credit card due date. SBI Cards is trading at 45x earnings, 6.1x book value, and just got a new CEO. Swipe with caution.
2. Introduction with Hook
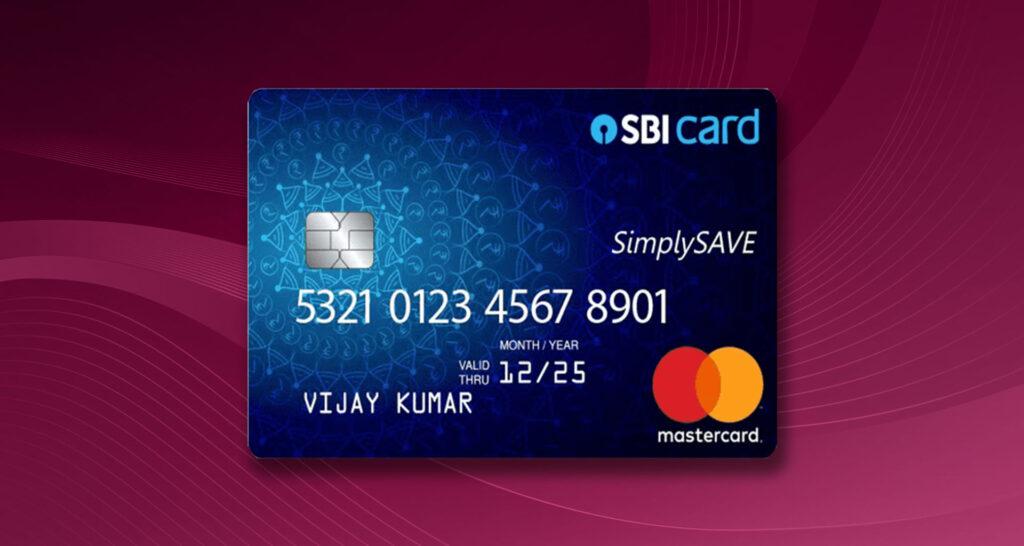
If your love language is cashback, SBI Cards might be your soulmate. This is India’s only listed pure-play credit card issuer, launched in 1998 and IPO’d in March 2020 — right before the world went into COVID-induced EMI freeze. Today, it serves 2+ crore cardholders, makes more money from interest than some small banks, and just replaced its MD.
But hold your applause:
- Revenue growth TTM: a modest 7%
- Net Profit TTM: -22%
- Gross NPA: 3.08% — not horrible, but your bank RM wouldn’t tell you that.
3. Business Model (WTF Do They Even Do?)
SBI Cards is what happens when a fintech bro grows up in a PSU family.
Core Biz:
- Credit card issuance and management (no debit, no deposits, no distractions)
- Revenue from interest, fees, late payment charges, and reward program tie-ups.
Revenue Breakdown:
- ~55%: Interest income
- ~35%: Fees & service charges
- ~10%: Other (read: everything else they could monetize)
Basically, they give you ₹1,00,000 of credit and charge you ₹1,25,000 if you’re late. Genius.
4. Financials Overview
Here’s the swipe-to-riches story, numbers first:
| Metric | FY23 | FY24 | FY25 TTM |
|---|---|---|---|
| Revenue (₹ Cr) | 13,670 | 16,986 | 18,591 |
| Net Profit (₹ Cr) | 2,258 | 2,408 | 1,878 |
| EPS (₹) | 23.87 | 25.32 | 19.73 |
| ROE | 26% | 22% | 15% |
| Gross NPA (%) | 2.41% | 3.08% | 3.08% |
Commentary:
Sales are up. Profits? Not so much. Financing margins have slipped from 19% to 11%. NPAs are creeping. Your card is safe — the stock, maybe not.
5. Valuation
Valuation is where this card maxes out.
- P/E: 45
- P/BV: 6.13
- Dividend Yield: A royal 0.28%
Fair Value Range: ₹720 – ₹800 (based on 30x P/E and 4.5x BV)
If you think 6x book is fine for a company with slowing profit, you probably also buy AirPods on EMI.
6. What’s Cooking – News, Triggers, Drama
- New MD & CEO: Salila Pande takes charge from April 2025. Investors are swiping right on the leadership change.
- GST Notice: ₹82 Cr input tax credit disallowance for 2018–21. CAs are sweating.
- Product Launches: Apollo SBI Card SELECT (25% value back), Tata Neu SBI Card — because every corporate wants a co-branded wallet magnet.
- Concall Spice: Analysts asking about NIMs, management responding with “volume growth”. Cute.
Plot twists pending Supreme Court verdicts and RBI circulars.
7. Balance Sheet
| FY | Equity | Reserves | Borrowings | Total Assets |
|---|---|---|---|---|
| FY23 | ₹946 Cr | ₹8,884 Cr | ₹31,110 Cr | ₹45,546 Cr |
| FY25 | ₹951 Cr | ₹12,830 Cr | ₹44,947 Cr | ₹65,546 Cr |
Asset-heavy. Borrowing-loaded. Debt is up 44% in two years. Someone’s charging a little too much on the backend.
8. Cash Flow – Sab Number Game Hai
| FY | CFO | CFI | CFF | Net CF |
|---|---|---|---|---|
| FY23 | -₹6,671 Cr | -₹921 Cr | ₹7,824 Cr | ₹232 Cr |
| FY24 | -₹5,452 Cr | -₹1,457 Cr | ₹8,401 Cr | ₹1,492 Cr |
| FY25 | -₹2,140 Cr | -₹2,491 Cr | ₹4,687 Cr | ₹55 Cr |
Operating cash flow is redder than your credit statement. Good thing they know how to raise debt like pros.
9. Ratios – Sexy or Stressy?
| Metric | FY23 | FY24 | FY25 TTM |
|---|---|---|---|
| ROE | 26% | 22% | 15% |
| ROA | 3.10% | 3.00% | 2.80% |
| Gross NPA | 2.41% | 3.08% | 3.08% |
| Net NPA | 0.89% | 1.46% | 1.46% |
| Cost-to-Income | ~63% | ~68% | ~70% |
ROE slipping like post-party wallet. GNPA rising. Margin stress is real.
10. P&L Breakdown – Show Me the Money
| FY | Revenue (₹ Cr) | PAT (₹ Cr) |
|---|---|---|
| FY23 | 13,670 | 2,258 |
| FY24 | 16,986 | 2,408 |
| FY25 TTM | 18,591 | 1,878 |
PAT decline of -22% YoY despite revenue up 9%. That’s not “profitable growth”, that’s “please swipe more.”
11. Peer Comparison
| Company | Revenue (₹ Cr) | PAT (₹ Cr) | P/E | ROE |
|---|---|---|---|---|
| Bajaj Finance | 73,107 | 17,425 | 32 | 19.2% |
| Cholamandalam | 25,846 | 4,263 | 29 | 19.7% |
| Muthoot Finance | 20,214 | 5,333 | 20 | 19.6% |
| SBI Cards | 18,591 | 1,878 | 45 | 14.8% |
SBI Cards is like the friend who shows up to the wedding wearing Gucci but borrowed it all on credit.
12. Miscellaneous – Shareholding, Promoters
Promoter Holding: 68.59% (unchanged, because daddy SBI holds the card)
FIIs: 10.23% (increasing)
DIIs: 17.5% (also increasing)
Public: Slipping like unpaid bills — now at just 3.68%
No. of Shareholders: Down to 7.74 lakh from 10.6 lakh in 2022 — a crowd that’s… deboarding?
13. EduInvesting Verdict™
SBI Cards is still the king of swipe, but there’s a slowdown in the kingdom. Margins shrinking, NPAs peeking, and valuation that’s screaming “elite access only.” Growth is there — but the profit party has moved to VIP.
A decent long-haul bus ride. But don’t expect champagne service.
Written by EduInvesting Team | 25 July 2025
Tags: SBI Cards, NBFC, Credit Cards, Financial Services, SBI Group, EduInvesting Premium, Q1 FY26 Analysis


